TEPPC Test Dataset
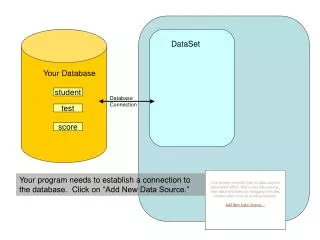
TEPPC Test Dataset. Powerflow Data. Powerflow Data Overview. In the Test Dataset there are Three areas . Twenty-two busses. Twenty-five AC transmission lines. Three transformers One DC transmission line. One phase shifter. Bus Numbering Convention.

TEPPC Test Dataset
E N D
Presentation Transcript
Powerflow Data Overview • In the Test Dataset there are • Three areas. • Twenty-two busses. • Twenty-five ACtransmission lines. • Three transformers • One DC transmission line. • One phase shifter.
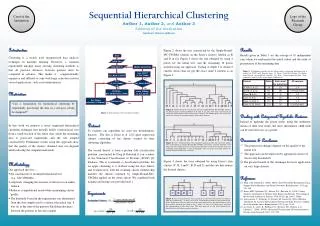
Bus Numbering Convention • The bus numbering scheme was set up to easily recognize which area a bus is located in. • Area 1 • Bus numbers are between 101 and 199. • There are seven busses in Area 1 (101 – 107). • Area 2 • Bus numbers are between 201 and 299. • There are seven busses in Area 2 (201 – 207). • Area 3 • Bus numbers are between 301 and 399. • There are eight busses in Area 3 (301 – 308).
102 500 kV 105 345 kV 101 104 Area 1 201 103 203 106 107 202 Area 2 204 Area 3 205 302 206 304 301 303 307 207 308 305 306
Transmission Line Parameters • The transmission line parameters (impedances and flow limits) were calculated using the transmission line length and voltage class. • Voltage Classes: 345 and 500 kV. • Lengths: 50, 75, 100, 150 miles. • The line parameters were calculated to ensure • Transmission line impedance values and flow limits are consistent based on voltage class and length. • Realistic flow patterns and congestion patterns for the Test Dataset’snetwork topology.
The transmission line impedances were calculated using typical per length impedance values (ohms / mile) for 345 and 500 kV lines (found in a GE reference manual). • The per length impedance values were converted to per-unit. • The per unit values were multiplied by each branch’s length to come up with a per-unit branch impedance. Calculating Transmission Line Impedances
A powerflow text book was used as a reference to find • Typical SIL values for 345 and 500 kV transmission lines. • The practical line loadability (in pu of SIL) for 50, 75, 100, and 150 mile long lines. • The typical SIL values were multiplied by the practical line loadability (in pu of SIL) values to get the calculated branch flow limits. • The calculated branch flow limits were divided by 4.15 to get the Adjusted Values (the Adjusted Values are used in the Test Dataset). • The flow limits had to be reduced from the Calculated Values to cause congestion in the Test Dataset. Calculating Transmission Flow Limits
102 500 kV 1 1.5 105 345 kV 1 101 104 2 1 2 201 2 103 2 1 106 107 1.5 203 202 1 3 3 204 2 3 1 3 205 302 1 206 1.5 3 304 301 303 1.5 1 1 307 1.5 207 308 305 2 306 1
There are three load Areas in the Test Dataset. • Area 1 is a winter peaking load area. • Area 2 and Area 3 are summer peaking load areas. Load Data Overview
System Load Busses • There are three load busses in each Area. • Area 1 • The load at Bus 102 consumes 30% of Area 1 load. • The load at Bus 103 consumes 20% of Area 1 load. • The load at Bus 105 consumes 50% of Area 1 load. • Area 2 • The load at Bus 203 consumes 50% of Area 2 load. • The load at Bus 204 consumes 20% of Area 2 load. • The load at Bus 206 consumes 30% of Area 2 load. • Area 3 • The load at Bus 301 consumes 50% of Area 3 load. • The load at Bus 305 consumes 30% of Area 3 load. • The load at Bus 306 consumes 20% of Area 3 load.
102 500 kV ASE - Annual System Energy HAL - Hourly Area Load 8% ASE 30% HAL (254-554) MW 105 345 kV 13% ASE 50% HAL (424-924) MW 101 104 201 103 5% ASE 20% HAL (170-369) MW 203 106 107 13% ASE 50% HAL (406-929) MW 202 204 5% ASE 20% HAL (162-371) MW 205 8% ASE 30% HAL (243-557) MW 302 206 303 24% ASE 50% HAL (686-1970) MW 304 301 307 308 14% ASE 30% HAL (412-1182) MW 305 306 9% ASE 20% HAL (274-788) MW 207
Generator Overview • There are 63 plants with a combined total of 8630 MW of Installed Capacity. • Thermal Resource Types • Nuclear, Coal, Combined Cycle (CC), Combustion Turbine (CT), Internal Combustion (IC), Steam. • Renewable Resource Types • Biomass (Bio), Geothermal (Geo), Wind, Solar • Other • Hydro, Pumped Storage, Demand Side Management (DSM)
Generator Naming Convention • Each generator’s name is derived from it’s gen type and the bus number it is located on. • For example • Coal_104 -> Coal plant on bus 104. • Nuclear_301 -> Nuclear plant on bus 301. • Wind_101 -> Wind farm on bus 101. • CC_103 -> CC plant on bus 103. • CT_305 -> CT plant on bus 305. • CT_305a -> Another CT plant on bus 305. • CT_305b -> Yet another CT plant on bus 305.
Thermal Dispatch Order • Based on the heat rates and fuel prices the resources will tend to be dispatched in the following order • Nuclear, Coal, CC, CT, IC, Steam, DSM • Nuclear and Coal plants are base loaded. • CC plants tend to move with the load. • CT and IC plants typically are used to meet peak load and spinning reserve requirements. • Steam resources are inefficient and typically used only during hours of peak load. • DSM is very inefficient and used sparingly.
102 500 kV 105 345 kV 101 104 Area 1 201 103 203 106 107 202 Area 2 204 Area 3 205 302 206 304 301 303 307 207 308 305 306
102 Area 1 500 kV 101 Hydro_102 CT_102 400 MW Hydro_105 CC_105 CT_105 CT_105a DSM_105 800 MW 105 345 kV 104 ASE - Annual System Energy HAL - Hourly Area Load 8% ASE 30% HAL (254-554) MW 103 Wind_101 150 MW 13% ASE 50% HAL (424-924) MW 106 Coal_104 300 MW 107 Hydro_106 CT_106 400 MW CC_103 CT_103 Coal_103 650 MW 5% ASE 20% HAL (170-369) MW
CC_203 CT_203 CT_203a CT_203b IC_203 Steam_203 DSM_203 730 MW Wind_201 150 MW Area 2 500 kV 345 kV ASE - Annual System Energy HAL - Hourly Area Load 13% ASE 50% HAL (406-929) MW Wind_202 Pump Storage_202 250 MW 201 CT_204 CT_204a IC_204 130 MW 203 202 5% ASE 20% HAL (162-371) MW 204 Coal_206 Coal_206a CC_206 Steam_206 1100 MW 205 8% ASE 30% HAL (243-557) MW 206 Solar_207 Solar_207a CT_207 150 MW 207
Area 3 500 kV 345 kV 302 Wind_302 150 MW ASE - Annual System Energy HAL - Hourly Area Load 304 Nuclear_301 CC_301 CT_301 CT_301a CT_301b Steam_301 Steam_301a DSM_301 DSM_301a 1350 MW 301 303 24% ASE 50% HAL (686-1970) MW Hydro_303 Geo_303 CT_303 430 MW 308 307 306 305 CT_305 CT_305a CT_305b IC_305 Steam_305 Steam_305a DSM_305 DSM_305a Pump Storage_305 780 MW 14% ASE 30% HAL (412-1182) MW 9% ASE 20% HAL (274-788) MW CC_306 Bio_306 CT_306 IC_306 Steam_306 DSM_306 660 MW Solar_308 50 MW
Other Relevant Information • No Forced Outages. • No Scheduled Outages. • PLF is used to model Hydro with a k factor of 1 and a 70% capacity factor. • Spinning reserve requirements for each area are 6% of load. • Fuel prices are given below.