Download

1 / 15
150 likes | 338 Views
Photoelectron Spectroscopy. Lecture 4: Deconvolution of complex ionization structure Band shapes with non-resolved vibrational structure Other complications Deriving chemical meaningful information. H 2 +. 18. 17. 16. vertical. adiabatic. 15. Ionization Energy (eV). H 2. 0. 1. 0.

E N D
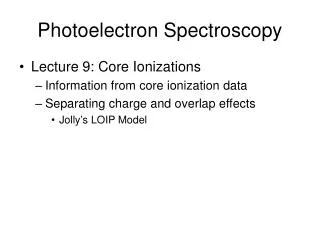
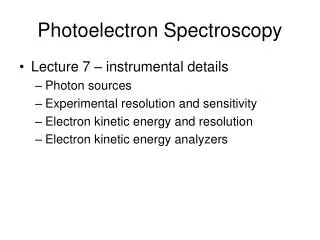
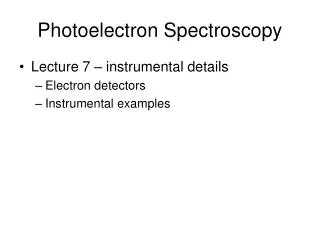
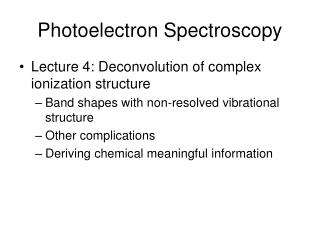
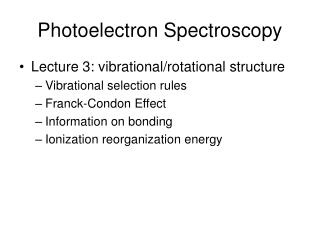
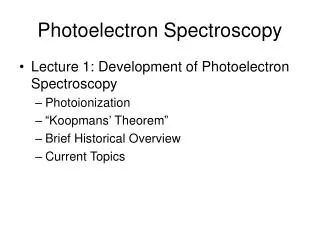
Photoelectron Spectroscopy • Lecture 4: Deconvolution of complex ionization structure • Band shapes with non-resolved vibrational structure • Other complications • Deriving chemical meaningful information
H2+ 18 17 16 vertical adiabatic 15 Ionization Energy (eV) H2 0 1 0 2 r (Å) This is the model we’ve defined… Lowest energy transition: Adiabatic transition (ν0 ➔ ν0) Most probable (tallest) transition: Vertical transition Ground state vibrational population follows a Boltzmann distribution: e-E/kT kT at room temperature is 0.035 eV (300 cm-1)
M(CO)6 Cr Cr Mo Mo W W 9.2 9.2 8.8 8.8 8.4 8.4 8.0 8.0 Ionization Energy (eV) Ionization Energy (eV) But things aren’t typically that simple! 2T2g Ionization of M(CO)6 This lump contains seven ionizations!
Factors we have to consider for inorganic/organic molecules of the type involved in your research: • Complicated vibrational structure • Multiple interdigitated modes • Vibronic coupling between final states • Additional final state effects • Jahn-Teller splitting • Spin-orbit splitting • Congested spectra • Inability to individually observe all ionizations of interest • And we have to figure this all out in a way that gives chemically meaningful information
Data Analysis of Spectroscopic Results The Bible: “Data Reduction and Error Analysis for the Physical Sciences”, Philip R. Bevington and D. Keith Robinson, 2nd Edition, McGraw-Hill, 1992 “We often wish to determine one characteristic y of an experiment as a function of some other quantity x. That is…we make a series of N measurements of the pair (xi,yi), one for each of several values of the index i, which runs from 1 to N. Our object is to find a function that describes the relation between these two measured variables.”
Fitting Data using WinFP • Use a series of functions, each defined with some number of degrees of freedom, to represent an arbitrary function, the spectrum. • Define an initial fit using your chemical intuition and knowledge about the molecule. • Have the computer perform a least-squares analysis to arrive at a fit that then best matches the experimental variables. • The specific method we are using to search parameter space, define conditions of convergence, and find a local minima is the Marquardt Method. See Chapter 8 of Bevington for details.
What function is appropriate? • Poisson distribution • Analytical form appropriate to measurements that describe a probability distribution in terms of a variable x and a mean value of x. • Appropriate for describing experiments in which the possible values of data are strictly bounded on one side but not on the other. • Non-continuous; only defined at 0 and positive integral values of the variable x • Guassian distribution • more convenient to calculate that the Poisson distribution • Continuous function defined at all values of x • Limiting case for the Poisson distribution as the number of x variables becomes large • Lorentzian distribution • appropriate for describing data corresponding to resonant behavior (NMR, Mossbauer) • Voigt Function: Combination of Lorentzian and Gaussian functions • Used to describe Lorentzian data with Gaussian broadening.
Modeling a potential energy surface with a symmetric Gaussian
Modeling a potential energy surface with an asymmetric Gaussian
How do we fit data in a chemically meaningful way? • Think about the expected electronic structure first! • Consider how many valence ionizations are likely to be clearly observed before the overlapping sigma bond region (lower than about 12 eV ionization energy). • Luckily, these are usually the ionizations related to the “interesting” orbitals of a molecule.
LCAO Model: The energies of the atomic orbitals are the starting point for the energies of the molecular orbitals Numbers with three decimal places are actual atomic ionization energies.Numbers with two decimal places are interpolated.Energies of unfilled p orbitals determined by excitation energy from the ground state.Transition metal d orbital energies interpolated between ionization of d1 configuration of group I element and d10 configuration of group VIII element.Lanthanides and actinides list ionization energies only. Adapted by Dennis Lichtenberger from Craig Counterman
What Influences MO Ionization Energies? • Ionization energies of atomic orbitals • Oxidation state, formal charge, charge potential • Bonding or anti-bonding interactions • See MO Theory presentation by Dennis Lichtenberger on the website for a detailed discussion of how to estimate MO ionization energies.
Some rough rules of thumb on the kinds of ionizations clearly observed for larger molecules • Transition metal d ionizations, 6-10 eV. • Aryl HOMO ionizations • Benzene 9.25 eV, doubly degenerate • Main group p lone pair ionizations • For halides, F ~14 eV, Cl ~11 eV, Br ~9 eV, I ~8 eV (SO splitting large for Br, I) • Metal-ligand dative bonds
Decide how many valence ionizations should be clearly observed • If band shapes = ionizations • Begin fitting using that number of Gaussians • If band shapes > ionizations • Consider possible causes; vibrational structure, spin-orbit splitting, etc. • Decide how this information should be chemically modeled. • If band shapes < ionizations • Fit using the minimum number of Guassians needed to define shape of the spectrum • Fit the spectra of a series of related molecules in a similar way so that comparisons can be made. • Least-squares analysis • Look at results, possibly iterate through the steps again until achieving a “good” fit that can be defended as giving chemically meaningful information.
Conclusions • Photoelectron band shapes can be modeled with asymmetric Gaussians functions. • Might not be able to analytically represent all data content, but do want to represent data in a consistent, chemically meaningful way. • When analyzing data, think, then fit.