Data Smoothing
Data Smoothing. A nursing home resident was rapidly losing weight with no social psychological explanation. Data from the medical records were collective.

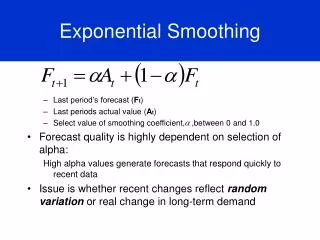
Data Smoothing
E N D
Presentation Transcript
Data Smoothing A nursing home resident was rapidly losing weight with no social psychological explanation. Data from the medical records were collective.
The previous graphic doesn’tillustrate the seriousness of the resident’s unexplainable weight loss. As a result the graphic default was changed and the following graph was created. Do you see how clearer the 2nd graph is?
Nursing Homes dietary staff collect data on the percentage of food consumed for each meal. Following is a graph for this data.
The previous graphic includes too much data. It is unclear. A smoothing technique was employed in the next graphic. Is the next graphic clearer?