Download
1 / 52
520 likes | 590 Views
Explore the impact of dust and cloud variability on climate using top-down/bottom-up approaches, focusing on model evaluation, physical processes, and parameterizations. Follow the GERB International Science Team's work to understand the radiative effects and feedbacks. Visit the RADAGAST project for animations and data analysis.

E N D
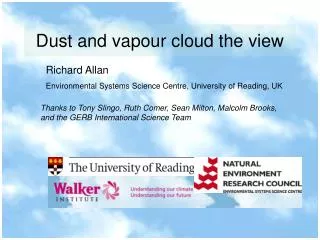
Richard Allan Environmental Systems Science Centre, University of Reading, UK Dust and vapour cloud the view Thanks to Tony Slingo, Ruth Comer, Sean Milton, Malcolm Brooks, and the GERB International Science Team
Introduction • Climate and NWP models • Model evaluation: • Top down/bottom up approach • Diagnosing variability and feedbacks • Nuts and bolts: model parametrizations and physical processes • fast feedbacks • Limitations of the observing systems
Clouds and Climate Intro 3 • Clouds and climate Bony and Dufresne (2005)
Objectives • Validation of new datasets (GERB/SEVIRI) • Timely Model Evaluation • Understanding of physical processes
GERB July 2006 OLR Animation Model Sinergee project: www.nerc-essc.ac.uk/~rpa/GERB/gerb.html
All-sky Clear-sky Mean model bias: 2006 Shortwave Longwave
All-sky Clear-sky Mineral dust aerosol Cirrus outflow Marine stratocumulus Shortwave Longwave Surface albedo Convective cloud
All-sky Clear-sky Mineral dust aerosol Shortwave Longwave
- Major dust source for Amazon - Large component from March 2004 dust storms
March 2004: an interesting month Loeb et al. (2007) J. Climate, 20, p.582 March 2006 was interesting too…
1200GMT, 6 March 2006 In these false-colour images, the dust appears pink or magenta, water vapour dark blue, thick high-level clouds red-brown, thin high-level clouds almost black and surface features pale blue or purple. On 6 March, unusually strong northerly winds bring cold air at low levels over the desert, creating a broad front of dust as the air moves south. The location of Niamey is marked by a cross. RADAGAST project: http://radagast.nerc-essc.ac.uk
1200GMT, 7 March 2006 In these false-colour images, the dust appears pink or magenta, water vapour dark blue, thick high-level clouds red-brown, thin high-level clouds almost black and surface features pale blue or purple. The shallow layer of cold air cannot rise over the mountains of the central Sahara (light blue in colour), so it is forced to follow the valleys. Streaks appear where it accelerates through gaps in the topography. The dust reached Niamey at 0930 on 7 March. RADAGAST project: http://radagast.nerc-essc.ac.uk
1200GMT, 8 March 2006 In these false-colour images, the dust appears pink or magenta, water vapour dark blue, thick high-level clouds red-brown, thin high-level clouds almost black and surface features pale blue or purple. By 8 March, dust covers the whole of West Africa and is moving out over the Atlantic. • Animation available: http://radagast.nerc-essc.ac.uk
et al… Surface Top of Atmosphere
Radiative transfer models underestimate the solar absorption in the atmosphere during March 2006 dust storm Slingo et al. (2006) GRL,33, L24817
Dust impact on longwave radiation • Large perturbation to Met Office model OLR during summer over west Sahara • Correlates with high mineral dust aerosol optical depth Model minus GERB OLR: July 2006, 12-18 UTC
Consistent with calculations of dust longwave radiative effect Haywood et al. (2005) JGR 110, D05105 Clear-sky OLR bias (Wm-2) in 2003 Calculations: Direct radiative effect Direct plus shortwave feedback effect
All-sky Clear-sky Radiative biases in the Met Office global model Cirrus outflow Marine stratocumulus Shortwave Longwave Convective cloud
Curious banding structure • Transition across model levels • Cloud reflectivity bias
Changes in albedo bias (ocean) • Model upgrade (March 2006) reduced but did not remove albedo bias • Compensating errors: ITCZ/stratocumulus
Cloud liquid water path Bias: model minus GERB; SSM/I; SEVIRI Albedo Liquid Water Path Cloud Reduction in model bias from June to July 2006 - relates to cloud liquid water
LWPWentz: overestimate for low cloud fraction? Overcast boundary layer clouds: good agreement TMIWentz/MODIS LWP Horváth and Davies (2007) JGR 112, D01202
Convective cloud 5th June 2006
Model evaluation: near-real time • Change in model minus GERB flux differences • Relate to change in model physics implementation Model SW albedo 2005 2006 13th March | 14th March
Convective Decay Time-scale • Unrealistically low levels of convective cloud • On-off; common problem in models • Simple fix…
Increased convective cloud cover • But is the physics any better? • Future work: Comparisons with CloudSat
Gulf of Guinea Model CloudSat 5th July 2006 19th July 2006
Clouds and water vapor • Combine GERB/SEVIRI • Diurnal changes in cloud and humidity • Radiatively driven subsidence • work by Ruth Comer
2-3 hr lag between tropical convection and upper tropospheric water vapor (Soden 2000, 2004) above: central/South Americaright: Lagrangian tracking
Tracking over Africa difficult?Complex picture locally due to propagating disturbances
Clouds and Water Vapor: Africa ~3-hour lag Work by Ruth Comer
Clear-sky radiative cooling and the atmospheric hydrological cycle • Clear-sky radiative cooling: • radiative convective balance • atmospheric circulation • Earth’s radiation budget • Understand clear-sky budget to understand cloud radiative effect • Datasets: • Reanalyses – observing system • Satellites – calibration and sampling • Models – wrong by definition
ERA40 NCEP SRB Tropical Oceans HadISST Ts CWV LWc SFC SMMR, SSM/I Derived:SMMR, SSM/I, Prata) 1980 1985 1990 1995 2000 2005 Allan (2006) JGR 111, D22105
Surface LWc and water vapour dLWc/dCWV ~ 1.5 Wkg-1 ERA40 NCEP dCWV/dTs ~ 3 kgm-2K-1 Allan (2006) JGR 111, D22105
Clear-sky OLR with surface temperature: + ERBS, ScaRaB, CERES; SRB Calibration or sampling?
ERA40 NCEP SRB Tropical Oceans Surface Net LWc Clear-sky OLR Clear-sky Atmos LW cooling QLWc HadISST ERBS, ScaRaB, CERES Derived Allan (2006) JGR 111, D22105
Linear least squares fit ERA40 NCEP • Tropical ocean: descending regime • Dataset dQLWc/dTs Slope • ERA-40 3.7±0.5 Wm-2K-1 • NCEP 4.2±0.3 Wm-2K-1 • SRB 3.6±0.5 Wm-2K-1 • OBS 4.6±0.5 Wm-2K-1
Implications for tropical precipitation (GPCP)? GPCP P ERA40 QLWc OBS QLWc Pinatubo?
IPCC AR4 models: tropical oceans • CWV • Net LWc • OLRc • Q_LWc
IPCC AR4 models: tropical oceans • QLWc • Precip Ongoing work…
Also considering coupled model experiments including greenhouse gas and natural forcings
Conclusions • Top down-bottom up approach • Good for feedback to modelers • Mineral dust aerosol • Shortwave absorption; longwave radiative effect • Large effect of single events • Marine stratocumulus • Reflectivity and seasonal variability: issues • Deep convection • Intermittent in models; issues with detrainment • Clear-sky radiative cooling • Links to atmospheric hydrological cycle • Need to understand before can understand changes in cloudiness • Observing systems: capturing decadal variability problematic
Spurious variability in ERA40 • Improved performance in water vapour and clear-sky radiation using 24 hour forecasts • Reduced set of reliable observations as input to future reanalyses?