Download
1 / 3
30 likes | 152 Views
Study on modulation amplitude impact on shifting and shading appearance; results for different observer types; potential individual perception differences identified.

E N D
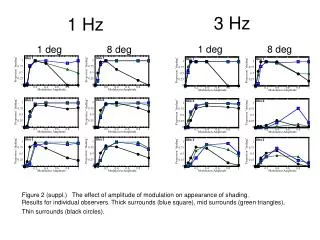
3 Hz 1 Hz Figure 2 (suppl.) The effect of amplitude of modulation on appearance of shading. Results for individual observers. Thick surrounds (blue square), mid surrounds (green triangles), Thin surrounds (black circles).
3 Hz 1 Hz Figure 3(suppl.) The effect of modulation amplitude on the appearance of shifting. Results for individual observers; Thick surrounds (blue square) mid-surrounds (green triangles), thin surrounds (black circles).
Amplitude 0.3 Amplitude 1.0 Figure 5 (suppl.) Surround-thickness thresholds for the perception of shifting (open squares) and shading (filled circles). Shifting measurements are high threshold (i.e., shifting is reliably reported for thicknesses less than the value of the threshold), Shading measurements are low thresholds (i.e., shading is reported reliably for Thicknesses greater than the value of the threshold). The column on the left shows thresholds for center amplitude equal to 0.3. For most observers the thresholds of shifting is greater than or equal to the thresholds for shading. The column on the right shows thresholds for center amplitude equal to 1.0. For most observers shading thresholds are greater than shifting thresholds. Indicating a gap where the disk appears neither to shift nor shade. Note that observer 6 is plotted on a slightly different scale. Observers 2 and 9 show flat shading curves. These observers reported seeing shading whenever a surround was present. This could be due to observer bias (the experiment was not forced choice). However a debriefing with these observers following the experiment indicates that, indeed, they perceived shading at all thickness levels. This suggests the possibility of fundamental individual differences.