Download
1 / 19
190 likes | 342 Views
Comparison of gridded multi-satellite rainfall estimates with gridded gauge rainfall over West Africa. Benjamin L. Lamptey February 1, 2007. Motivation. Usefulness of satellite imagery Rainfall estimation over areas with a low density of rain gauges

E N D
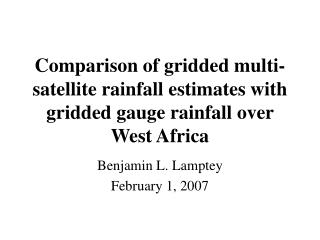
Comparison of gridded multi-satellite rainfall estimates with gridded gauge rainfall over West Africa Benjamin L. Lamptey February 1, 2007
Motivation • Usefulness of satellite imagery • Rainfall estimation over areas with a low density of rain gauges • in providing data with spatial resolution closer to that of the numerical models • Flood warnings, river estimates or water management • Extent to which satellite can be relied upon to give a good database needed for the analysis of rainfall variability
Datasets • GPCC (VASClimO) • Sources include CRU, FAO, GHCN, GTS (over 27,000 stations) • Global dataset • GPCP • Sources geo-IR (from NOAA and NCEP), microwave • Covered 40degN to 40degS • Period of analysis:1979 - 2000 • Resolution is 2.5deg by 2.5deg
Areas of comparison • Mean annual, seasonal and monthly rainfall • Spatial variability over the domain at the annual and seasonal time scales • Inter annual variability in the three regions • The mean state and fluctuations during El Nino and La Nina events • Trends in either dataset
Kendall’s tau • Gauge • Prob = 3.04E-05 • Satellite • Prob = 2.83E-02
Conclusion • The satellite can be relied upon for the climatology and inferences about latitudinal bands • Datasets agree more in the northern latitudes than in the southern latitudes • Both datasets indicate statistically significant trends • Satellite data indicates more rainfall over the highlands of Cameroon but less over the highlands of Guinea • Performance of satellite is no different during El Nino/La Nina events regarding spatial distribution