STANDARDISED PRESENTATION OF INTERFERENCE DATA FOR LIMIT SETTING
110 likes | 258 Views
This poster presents a standardized graphical approach for assessing interference data from hemolysis, lipemia, and icterus, aimed at facilitating decision-making in clinical chemistry. Using an Olympus AU2700 analyzer, we collected quantitative interference data and created a spreadsheet application to display multiple data sets, including performance limits and biological variation. This tool enhances the ability to set interference limits, ultimately improving diagnostic accuracy. Our findings underscore the need for standardized criteria in interpreting interference data in laboratory settings.

STANDARDISED PRESENTATION OF INTERFERENCE DATA FOR LIMIT SETTING
E N D
Presentation Transcript
STANDARDISED PRESENTATION OF INTERFERENCE DATA FOR LIMIT SETTING BJ Martin, P Graham, M Roser, GRD Jones Chemical Pathology, St Vincent’s Hospital, Sydney, Australia Interferences APCCB
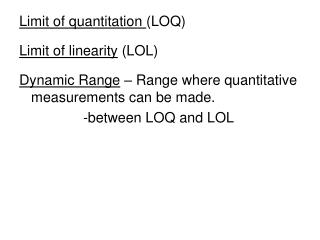
Background • Interference studies are commonly performed for potential interferences from haemolysis, lipaemia and icterus. • The assessment of this data is difficult as there is no standardised criteria for decision making in this area. • In this poster we demonstrate a graphical presentation of interference data to facilitate the process of setting interference limits. Interferences APCCB
Methods - Samples • Interference data was generated as follows: • In-vitro haemolysis model: • Fresh haemolysate at various concentrations from a single donor was added to serum pools. • Fresh haemolysates from different donors were added to a single serum pool at a single concentration. • Lipaemia Model: • Intralipid™ was added to serum pools at various concentrations. • Samples were measured on an Olympus AU2700 analyser with user-defined quantitative “H” and “L” indices Interferences APCCB
Methods – Olympus Indices • Serum Indices for Haemolysis (H) and Lipaemia (L) were set up on an Olympus AU2700: • Two additional tests were installed (APP and APP1) • Wavelengths: APP 570 (primary) / 600 (secondary) • Wavelengths: APP1 600 (primary) / 700 (secondary) • Sample volume: 6uL, reagent volume (saline): 125 uL • Calculations • L = 88.95 * APP1 • H = 3773.12* (APP – (1.25* (APP2)) • These quantitative indices were based on Hitachi serum indices and are used in place of the Olympus proprietary semi-quantitative indices. Interferences APCCB
Methods - Spreadsheet • Interference data was entered into an Excel spreadsheet application. • Other Inputs • RCPA-AACB QAP Allowable Limits of Performance (ALP) • Within-individual Biological Variation (CVwi) • Instrument / method / setup criteria • Date of interference data • The aim of the application is to display all the required information for decision making on the same screen or printout. Interferences APCCB
Application Display • Graphical displays • Raw data • Data expressed as absolute and fractional changes • Multiple data sets of serial interference addition (up to 3 at a time) • Multiple sets of individual haemolysate preparations (up to 18 different haemolysates) • On the same graphs was displayed: • the RCPA-AACB QAP allowable limits of performance • The within-person biological variation. • The chart included • Analytical method, date, catalog number • Analytical CV Interferences APCCB
Application Use • Change analytes for review in 2 or 3 keystrokes • Select data sets by single letter codes • Review current cutoffs and review alternate cutoffs • Graphically • Numerically (requires selection of data set by single letter code) • Allows direct comparison of data sets according to: • Instrument • Date • Method • Type Interferences APCCB
Current &proposedcutoffs Test Name Calculatedeffects Data setdetails Raw Data AbsoluteChange CalculationData Current Cuttoff Proposed Cuttoff Available Data sets foranalyte Relative Change ALPColor coded Interferences APCCB
Conclusions • We have developed a spreadsheet application allowing easy graphical display of multiple data sets for interpretation of interference data. • The data demonstrated has been generated on an Olympus AU2700 using user-defined, quantitative serum indices. • The application allows improved target setting for allowable interference limits. Interferences APCCB