Download
1 / 41
410 likes | 611 Views
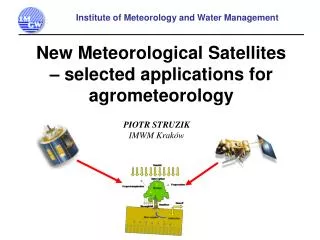
Institute of Meteorology and Water Management. „ Extreme agrometeorological events early warning and monitoring with use of satellite information ” PIOTR STRUZIK Institute of Meteorology and Water Management Kraków, POLAND. Institute of Meteorology and Water Management .

E N D
Institute of Meteorology and Water Management „Extreme agrometeorological events early warning and monitoring with use of satellite information” PIOTR STRUZIK Institute of Meteorology and Water Management Kraków, POLAND
Institute of Meteorology and Water Management • Presentation outline: • Introduction – agrometeorological hazards. • Hazards and satellite data use: • Drought • Floods • Fire hazards. • Heavy storms and extreme precipitation • 3. Conclusions. • 4. Recommendations (to be discussed)
Agriculture disasters • Agricultural disasters may not be as dramatic as a volcanic eruption or a hurricane, but they are by far the most damaging. Worldwide, drought alone has been responsible for millions of deaths and has cost hundreds of billions of dollars in damage. • Different climatic events can trigger crop failures including: • excess rainfall leading to flood damage or crop disease, • heat waves, • drought, • fire, • unexpected cold snaps, • severe storms, • climate-related disease outbreaks, • insect invasions. Earthquakes Tsunamis Volcanoes Tropical Cyclones Desertification Deforestation But also:
Large-scale weather phenomena affect agriculture world-wide by changing rainfall patterns: El Niño, La Niña (El Niño costs about $2 billion in agricultural losses in the USA) Pacific Decadal Oscillation. Regional (small scale) weather phenomena: Excessive rainfalls/ lack of rain, Storms – hail, strong wind, tornadoes, Fire – both natural and man induced, Flooding, Insects and diseases favorable conditions
Satellite remote sensing provides a way to monitor worldwide agriculture. • Measurements of radiation balance and evapotranspiration provide information on energy and water exchange at the surface (pre-drought conditions, fire risk). • Cloud-cover, rainfall patterns, storm detection, fire detection, are useful both for warning and monitoring of extreme events; • Vegetation/thermal index measurements (NDVI/EVI/VCI/TCI…) record vegetation state and possible anomalies • High- and moderate-resolution sensors provide images of crop areas (pre-disease risk assessment / post disease damage assessment);
Use of satellite data at each step • To consider actual and potential use of satellite information for agrometeorological hazards’ monitoring we have to look at: • Types of Agromet Disasters • Phases of a Disaster • Effects of Disasters • Prevention, Mitigation • and Preparedness
example Assessment of burned area, Protection of watersheds and critical resources Fire detection, estimation of size, frequent repetition of observations Risk assessment Identification of areas: human settlements, property, natural resources Satellite: Detection of temperature, smoke plumes, night light Satellite: Monitoring of damage extend with different resolution Satellite: Vegetation stress variables, live and dead veg. moisture content. fire management preparedness detection and response post-fire assessment.
Fire monitoring systems (space-based) fuel biomass condition (living or dead); biomass quantity; moisture content; vertical and horizontal structure (continuity). weather impact: wind velocity, wind direction, relative humidity, precipitation, temperature. topographic factors:aspect (steepness, orientation and position) of the terrain; elevation; shape of the terrain (for example, ridge, canyon, flat terrain).
Fires in Quebec Smoke continued to pour from fires in the Quebec province of Canada on June 2, 2005. Scores of fires have been burning in the area since the end of May. According to reports from the Canadian Interagency Forest Fire Center, at least 20 of the 83 fires burning as of June 2 were out of control. Nearly all the fires were started by lightning.
Fires in Northern Territory, AustraliaIn the northern parts of Australia’s Northern Territory, April and May are months when people conduct planned burning in order to reduce underbrush and prevent more damaging fires later in the dry season. This image of Northern Territory captured by the MODIS on NASA’s Aqua satellite on May 17, 2005, shows many fires (marked in red) burning in the region around Darwin. About 150 to 175 kilometers east and southeast of Darwin, the fires are burning in the Kakadu National Park, part of the ancestral lands of the country's Aboriginal people. The traditional, often ceremonial, burning that occurs at this season is part of the relationship of people with the landscape that has gone on in the region for thousands of years.
Fires and Smoke in North KoreaOn May 3, 2005, the Moderate Resolution Imaging Spectroradiometer (MODIS) on NASA’s Aqua satellite captured this image of smoke pouring from dozens of fires (marked in red) in North Korea. These fires could be related to agricultural burning; however, the huge plumes of smoke blowing eastward from some of the coastal fires suggest that those blazes are forest or other wildland fires. Much of the Korean Peninsula’s precipitation falls between June and September during the “wet” monsoon phase. Therefore, these fires are burning at one of the driest times of the year.
Drought • Drought is the most important weather-related natural disaster. • During 1967-1991, droughts affected 50 percent of the 2.8 billion people who suffered from all natural disasters and killed 35 percent of the 3.5 million people who lost their lives to natural disasters. • We cannot avoid drought, and our predictions will never be perfect, but we can reduce its impacts. • Large-scale intensive droughts have been observed on all continents, leading to: • - massive economic losses • - destruction of ecological resources • - food shortages • - starvation for millions of people • Reducing Drought Consequences • - Drought prediction • - Monitoring and early warning • - Assessment of impacts • - Response Satellite information use
Drought Monitoring and Early Warning Rainfall, surface wetness and temperature monitoring:multi-channel and multi-sensor data sources from geostationary platforms (such as GOES, METEOSAT, INSAT, GMS) and polar orbiting satellites (such as NOAA, DMSP SSMI) have been used, or are planned to be used. Estimated parameters are precipitation intensity, amount, and coverage, atmospheric moisture and winds, and surface (soil) wetness (sometimes). Vegetation monitoring:vegetation condition monitoring is currently possible, ranging from NOAA AVHRR data at 1.1km resolution in a daily revisit, to environmental satellites (LANDSAT etc.) in on in a 8-16 day revisit with 10-30 m resolution. The normalized difference vegetation index (NDVI) and its anomalies (VCI), temperature condition index (TCI) derived from the satellite data is accepted worldwide for regional monitoring. Assessment of drought impact:high-resolution satellite sensors from LANDSAT, SPOT, IRS, (among others) are being used for the assessment of impacts in a few areas, but in most cases this is not a country-wide activity.
Satellite use for drought management support • GOES, METEOSAT, INSAT, GMS are used for prediction • NOAA/AVHRR, IRS/WiFS, SPOT4/Vegetation are used for monitoring and early warning • DMSP/SSMI and IRS-P4 MSMR data should be investigated, together with the existing approaches, as a drought information • TRMM, RESOURCESAT, MODIS and MERIS need to be evaluated for monitoring • LANDSAT,IRS,SPOT is used for GIS based drought management system
Drought in Brazil Rio Grande do Sul, the part of Brazil in the center of this image, is one of Brazil’s richest states. The state is Brazil’s largest rice producer, second largest wheat producer, and third largest corn and soybean producer. During the summer of 2004/2005, this heavily agricultural region plunged into severe drought, its worst in 35 years. Little rain fell between December and March, the summer months in the Southern Hemisphere, and the cost to agriculture could measure in the billions, according to local news reports. The image, a composite of data collected by NASA’s Moderate Resolution Imaging Spectroradiometer (MODIS), shows where vegetation was less dense and healthy than normal between March 22 and April 6, 2005, compared to data collected during the same period between 2000 and 2004.
Drought in East Africa Six successive years of poor rain have left Eastern Africa in severe drought. Rain typically falls between February and June, and 2005 looked promising when rains started to fall in January. The promise dried up, however, when the rains stopped, leaving the latter half of March and the first half of April dry. The cumulative impact of poor rainfall on plants is visible in this vegetation anomaly image. The image was created using data collected by the Advanced Very High Resolution Radiometer between April 11, and April 20, 2005, compared to average conditions.
Drought on the Iberian PeninsulaAs May draws to a close, Spain and Portugal are entering the summer dry season already parched from a record-dry winter. Between November 2004 and March 2005, Spain experienced its driest winter since records began in 1943, reported the Spanish Meteorological Institute. Portugal is experiencing its worst drought in 25 years. The U.S. Department of Agriculture’s Foreign Agricultural Service estimated rainfall totals for both Spain and Portugal to be as much as 75 percent below average between September and February.
Drought in Poland - 1993 2nd half of July 2nd half of August 3rd decade of September Vegetation indices
Large tributaries of Danube river are practically without ground measurements (eg. Tisa) Floods Floods are among the most devastating natural hazards in the world, claiming more lives and causing more property damage than any other natural phenomena. Within the USA, an average of more than 225 people are killed and more than US$3.5 billion in property is damaged by heavy rain and flooding each year. As a result, floods are one the greatest challenges to weather prediction. starting on April 20, 2005 Romania worst flood since 50 years (several dams were broken)
Remote sensing management cycle: • Prevention where history, corporate memory and climatology are important, • Mitigation that insulates people or infrastructure from hazards, • Pre-flood, which is the preparation and forecast stage where remote sensing is essential, • Response (during the flood) where actions to be taken is of key importance and weather NOWCASTS (0 - 3 hour prediction of precipitation) using remote sensing is extremely useful, • Recovery, (post flood) which is the postmortem stage where damage assessment procedures are taken, but also numerical weather prediction and hydrological models are validated.
The potential of high and low resolution polar orbital Earth Resource Satellites have been shown to be an excellent tool for providing hydrological information including the quantification of catchment physical characteristics, such as topography and land use, and catchment variables such as soil moisture and snow cover. There have been many demonstrations of the operational use of these satellites for detailed monitoring and mapping of floods and post-flood damage assessment: • Infrastructure status • Land use • Vegetation • Soil Moisture • Snow pack • DEM pre- and post-flood • Flood development of Flood peak • Damage assessment • Bathymetry pre- and post-flood
Piechowice reservoir destroyed in 1997 flood. Limnigraf destroyed during 1997 flood - Oława
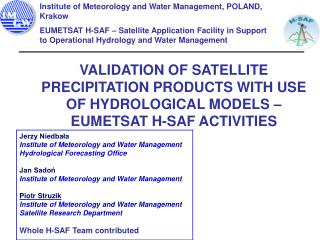
Remote sensing information in operational hydrology and flood warning and monitoring 1.Compared to other natural hazards, flooding is the most widespread and most damaging natural risk in Europe. 2. Large river basins cross the national borders. 3. Close co-operation between between different countries is necessary. 4. Integration of different sources of information: satellite, radar, models, ground observations. 5. There is still lack of direct link between satellite products providers and the end-user involved with hydrological models. 6. The „EUMETSAT Hydrological SAF” is proposed for development of operational products related to hydrology.
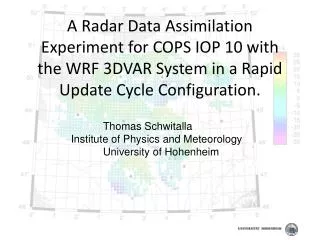
Example of successful use of METEOSAT IR+VIS derived precipitation in hydrological modelling.
Floods in Hungary and Serbia in April 2000 – SAR satellite image
Among many weather phenomena, one of the most dangerous and causing greatest damages are storms. • 1. Storms are phenomena of relatively small spatial (5 - 200 km) and temporal (0.5-6 h) extent. • 2. Storm forecasting is most problematic and the error is highest (hydrostatic models). • 3. Storms are frequently connected with: • heavy precipitation, • strong wind, frequently damaging, • lightnings, • hail, • tornadoes.
Direct effect of mentioned phenomena is very frequently: • flush floods (water or mud floods), • fires of the houses, farm buildings, technical infrastructure as a result of lightnings • buildings and forest damages as a result of strong wind (hurricane), • crop and property damages due to hail storms. In extreme conditions those cases are cumulating on relatively small area, leading to tremendous material losses, or even to human live loss.
Development of flash flood as a result of severe storm (Switzerland)
12 July 1984 Munich hailstorm (caused total economical loss of 3 mln DM)
Available remote sensing information for detection and monitoring of storms (in Europe): • 1. Meteorological radars. • 2. Lightning detection systems. • 3. Geostationary satellite Meteosat-7 (until end of 2005). • 4. System Rapid Scan from Meteosat-6 satellite. • 5. NOAA polar orbiting satellites. • 6. Geostationary satellite MSG (since 2004 operational). • In near future: • European polar orbiting satellite Metop (Feb. 2007). • American NPOESS satellites (first 2008-2009). • 3. GPM (Global Precipitation Mission) planned 2008, postponed to 2010 – 2015,
Use of satellite information: • Determination of the area of intensive convection leading to storm development and connected intensive precipitation - atmospheric stability indices. • Detection of storm cells and determination of its actual phase (developing, decaying) - geostationary satellite data Meteosat (MSG). • Following of storm trajectories and nowcasting of its future development - Meteosat (MSG). • Determination of rain intensity, rainfall amount - blended methods (different sensors).
Early detection of the area where intensive convection is expected. Atmospheric stability indices: 1. Available from the NWP model (mezoscale). 2. Determined from satellite vertical sounding - TOVS/NOAA information. 3. Determined from geostationary satellite MSG (every 15 min). More then 20 different stability indices is in use, based on vertical distribution of temperature, moisture, dew point temperature, potential temperature, mixing ratio etc. like: CAPE, Showalter, Adedokun, Lifted Index, Telfer, KI, KO, TotalTotals and many others. Atmospheric stability indices allow for forecast/nowcast of convective phenomena a few hours in advance.
Sequence of satellite images K Index
3 persons killed 6 injured Big damages of infrastructure Crops damaged or completely flushed out from the fields In certain areas 60 mm/h precipitation rate was recorded
Locusts Plague Northwest and Western Africa Swarms of locusts can contain as many as 80 million locusts per square kilometer, and may cover several square kilometers. An adult locust can eat its own weight in food every day, a small part of a typical swarm can eat as much food as 2,500 people in a single day. The locust outbreak of 2004 began in Morocco and Algeria in northwestern Africa. While the locusts can't be seen in satellite imagery, the conditions that support them are clearly visible. In the lower image, a composite of data collected between August 28 and September 4, 2004, pockets of green in southern Mauritania, Senegal, Mali, and Burkina Faso show where the locusts are finding food and breeding. The most recent information from FAO shows that these are indeed the areas where the locusts are concentrated.
CONCLUSIONS 1. Satellite data proven, that can be treated as useful tool in disaster management (including agrometeorological). 2. Satellite information cannot be treated as separate tool, its advantage is in use together with appropriate models (as model inputs and/or parameters). Fancy images are nice but decision making process is based on proper interpretation of actual and forecasted situation. 3. User requirements are growing together with development of more detailed models. Development of new satellites and its sensors is much slower process. Early recognition of potential user demands is essential. 4. Access to satellite products is better in developed countries while their value is highest in less developed countries with scarce ground observation network.
Recommendations for the future (for discussion) • In geographic areas where rapid response is required, an operational satellite wildland fire detection and monitoring system with an ultimate fire detection time of 5 minutes, a repeat time of 15 minutes, a spatial resolution of 250 meters, a maximum of 5% false alarms is required. • Assimilation of satellite data into coupled ocean/atmosphere/land models used for drought predictions. • altimeter measurements of ocean topography, with the quality of TOPEX/POSEIDON, to be used as a starting field in coupled-model El Nino predictions (Jason mission ?) • Development of methods for the integration of satellite, in-situ and GIS data for input into models (hydrological, fire risk …) • Development of multi-sensor/satellite integration methods • Addition of microwave sensor on geostationary satellites. • Improve satellite rainfall estimation techniques • Estimation of soil moisture and snowpack characteristics from high resolution microwave data. • Increase temporal frequency of polar orbiting satellite data acquisitions. • Decrease time required to acquire and deliver remotely sensed data. • Lower the cost of remotely sensed data. • Education/Training to build local capability. • International coordination of data acquisitions.