Download
1 / 32
320 likes | 603 Views
Development indicators Gianni Vaggi and Clara Capelli University of Pavia November 2013. The Human Development Index. 1990 Human Development Report ( Mahbub Ul Haq , Amartya Sen et al).

E N D
Development indicatorsGianni Vaggi and Clara CapelliUniversity of Pavia November 2013 The HumanDevelopmentIndex
1990 Human Development Report (MahbubUlHaq, AmartyaSen etal) Development goes beyond economic growth, encompassing humanwell-being: Human development is a process of enlarging people’schoices.; The term human development denotes both the process of wideningpeople’s choices and the level of their achieved well-being: Deprivation in income; Deprivation in life expectancy;Deprivation in literacy. Focus on the formation of the capabilities and their use. EconomiadelloSviluppo
Three dimensions Health and Longevity: Life expectancy Index Knowledge and Education: Education Index Standard of living: Income Index. EconomiadelloSviluppo
How to calculate it/Before 2010 • Life expectancy at birth; • Adult literacy rate (2/3) and the combination of primary, secondary, and tertiary gross enrollment ratios (1/3); • Natural Logarithm of GDP per capita at PPP. EconomiadelloSviluppo
How to calculate it/Before 2010 EconomiadelloSviluppo
How to calculate it/After 2010 • Life expectancy at birth; • Mean years of schooling and expected years of schooling; • Natural Logarithm of GNI per capita at PPP.
Source: HD Report, 2010 EconomiadelloSviluppo
How to calculate it/After 2010 EconomiadelloSviluppo
Source: HD Report, 2011 EconomiadelloSviluppo
Why these changes? Indicators for education were regarded as not that informative; GNI is more accurate, as it includes international flows and excludesincome generated domestically but repatriated abroad; The geometric mean accounts for difference in achievement acrossdimensions, reducing the level of substitutability between dimensionsand ensuring that a x-percent change in one index has the sameimpact on the HDI, regardless to the index.
Aren’t you convinced? LEI = 0.3 ; EI = 0.3 ; II = 0.8 Arithmetic Average = 0.467;Geometric Mean = 0.416; Change of 10% in the income index (it gets 0.88): Arithmetic Average = 0.493 (+5.57%);Geometric Mean = 0.429 (+3.125%). Change of 10% in the life education index (it gets 0.33): Arithmetic Average = 0.477 (+2.14%); Geometric Mean = 0.429 (+3.125%). EconomiadelloSviluppo
Very high HDI 1 Norway 0.955 2 Australia 0.938 3 USA 0.937 4 Netherlands 0.921 5 Germany 0.92 6 New Zealand 0.919 7 Ireland 0.916 8 Sweden 0.916 9 Switzerland 0.913 10 Japan 0.912 Source: HD Report, 2013
Low HDI 1 Gambia 0.439 2 Djibouti 0.445 3 Zambia 0.448 4 Uganda 0.456 5 Haiti 0.456 6 Yemen 0.458 7 Togo 0.459 8 Lesotho 0.461 9 Nepal 0.463 10 Papua New Guinea 0.466 Source: HD Report, 2013
1980 1990 2000 2005 2010 2012 55 Russia 0.730 0.713 0.753 0.782 0.788 57 Saudi Arabia 0.575 0.653 0.717 0.748 0.777 0.782 59 Cuba 0.626 0.681 0.690 0.735 0.775 0.780 71 Venezuela 0.629 0.635 0.662 0.694 0.744 0.748 76 Iran 0.443 0.540 0.654 0.685 0.740 0.742 85 Brazil 0.522 0.590 0.669 0.699 0.726 0.730 101 China 0.407 0.495 0.590 0.637 0.689 0.699 112 Egypt 0.407 0.502 0.593 0.625 0.661 0.662 114 Philippines 0.561 0.581 0.610 0.630 0.649 0.654 121 Indonesia 0.422 0.479 0.540 0.575 0.620 0.629 135 Ghana 0.391 0.427 0.461 0.491 0.540 0.558 136 India 0.345 0.410 0.463 0.507 0.547 0.554 145 Kenya 0.424 0.463 0.447 0.472 0.511 0.519 186 RDC 0.286 0.297 0.234 0.258 0.295 0.304 Source: HD Report, 2012 EconomiadelloSviluppo
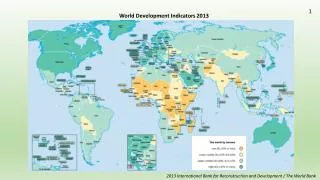
The Human Development Index Source: HD Report, 2013
Some Criticisms The environmental issue is completed overlooked; National focus which neglects the "global" perspective; Only material aspects of life: what about human rights, freedom,gender equality; Debatable comparability along time.
Other Indices from the HDR The Human Poverty Index for developing countries (HPI-1);The Gender-Related Development Index (GDI);The Gender Empowerment Measure (GEM);Inequality-adjusted HDI (IHDI); Gender Inequality Index (GII); Multidimensional Poverty Index (MPI).
Other Indices Happy Planet Index (HPI);Gross National Index (GNH);Living Planet Index (LPI); Physical Quality of Life Index (PQLI);Genuine Progress Indicator (GPI).
Other reports Stiglitz, J., Sen, A., Fitoussi, JP. (2008), Report by the Commission on the Measurement of Economic Performance and Social Progress. Alkire, S., Roche, J.M. and Seth, S. (2013) Multidimensional Poverty Index 2013, www.ophi.org. Helliwell, J., Layard, R. and Sachs, J. (2013), World Happiness Report 2013, New York, Earth Institute. UNU-IHDP and UNEP, Inclusive Wealth Report 2012. Measuring progress towards sustainability, Cambridge University Press, Cambridge.
Source: HD Report, 2013 EconomiadelloSviluppo
Source: HD Report, 2013 EconomiadelloSviluppo