Download
1 / 21
210 likes | 484 Views
Development indicators Gianni Vaggi and Clara Capelli University of Pavia November 2013. Poverty. Choosing and estimating poverty lines. Monetary (e.g. a certain level of consumption) Nonmonetary (e.g. a certain level of literacy).

E N D
Development indicatorsGianni Vaggi and Clara CapelliUniversityof Pavia November 2013 Poverty
Choosing and estimating poverty lines • Monetary (e.g. a certain level of consumption) • Nonmonetary (e.g. a certain level of literacy) • Relative/national poverty lines: in relation to the overall distribution of income or consumption in a country. Strictly related to inequality (Sen1983). • Absolute poverty lines: anchored to some absolute standard (seethe cost of basic needs approach). Sometimes "absolute poverty" isused as a synonym of "extreme poverty".
Measuring extreme poverty at world level: The 1990 WDR • Standards of living (incomes and consumption), plus measures of nutrition, life expectancy, child mortality and school enrollment rates. • Poverty lines: "A consumption-based poverty line can be thought of comprising two elements: • the expenditure necessary to buy a minimum standard of nutrition and other basic necessities; • a further amount that varies from country to country, reflecting the cost of participating in the everyday life of society“. • A person can appear in public without shame (Adam Smith 1776). 1985 Total population: 4,8 billion. More than 1 billion people under the poverty line.
The Absolute Poverty Lines • 1990 WDR: $ 1 per day in 1985 US$ (Ravaillon, Datt, Van DeWalle): first global poverty threshold; • 2000: $ 1.08 per day in 1993 US$ prices(Chen and Ravaillon); • 2008 "Dollar a Day Revisited" (Ravaillon, Chen, Sangraula): the lineis set at $1.25 (PPP 2005); • $2 poverty line ($2.15 in 2000, $2.50 in 2008).
Measuring the international poverty line 1990 Country-poverty lines of six developing countries clustered around $370 (1985 PPP) a year : the 1-dollar-a-day story was born. 2000 1.08 dollar a day. 75 poverty lines examined, 15 lowest taken(Nepal Tajikistan and 13 SSA countries) ; a person is poor if she consumes less than an American spending 1.08 USD at 1993 prices. All data derive form national household consumption surveys, which are based on a sample of the whole population. If you use GDP from national account extreme poverty is much lower(see Salai Martin)
Choosing and estimating poverty measures Once the line has been set, poverty is to be measured in terms of its: Incidence/headcount index: share of the population whose income or consumption is below the poverty line. Depth/poverty gap: how far off household are from the poverty line, is the mean shortfall from the poverty line (counting the non-poor as zero shortfall) expressed as a percentage of the poverty line
Choosing and estimating poverty measures incidence, depth and severity:
People living on less than 1.25 a day (millions): • 1,909 in 1990; • 1,289 in 2008; Poverty Headcount ratio at 1.25 a day: • 43.1% in 1990; • 22.4% in 2008; Source: PovcalNet
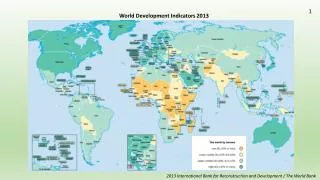
Source: WDI, 2012 EconomiadelloSviluppo
Regional focus • The greatest reduction in poverty occurred in East Asia andPacific: • From 77% in 1981 to 14% in 2008; • In absolute terms, the poor population dropped by 800 million; • Such decline is mostly attributable to China (from 84% to 13%, 660million people). • In South Asia, poverty rate fell from 61% to 36%; • Sub-Saharan Africa’s performance was poor: the poverty rate wasapproximately 50% in 1981, it rose to nearly 60% in 1993 and thendropped to 47.5% in 2008. The number of people below the povertyline has nearly doubled in this time span and started declining onlyfrom 2005 onwards. EconomiadelloSviluppo
Most of the people who have escaped extreme poverty are still"poor", i.e. they live below the $2a-day line; • People living below this line dropped from 70% in 1981 to 43% in2008; • In absolute terms, the number is constant at 2.5 billion people; • The largest decrease occurred in East Asia and Pacific, thanks toChina; • At global level, the number of people living on $1.25-$2 a day nearlydouble, hitting 1.2 billion. EconomiadelloSviluppo
China/1 GDP per capita, USD, Atlas method Source: WB Database EconomiadelloSviluppo
China/2 $1.25-a-day Poverty Line, Headcount Ratio Source: WB Database EconomiadelloSviluppo
China/3 $2.50-a-day Poverty Line, Headcount Ratio Source: WB Database EconomiadelloSviluppo
India/1 GDP per capita, USD, Atlas method Source: WB Database EconomiadelloSviluppo
India/2 $1.25-a-day Poverty Line, Headcount Ratio Source: WB Database EconomiadelloSviluppo
India/3 $2.50-a-day Poverty Line, Headcount Ratio Source: WB Database EconomiadelloSviluppo