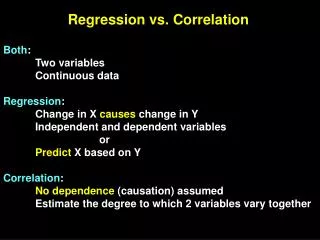
Correlation vs. Causation
Correlation vs. Causation. What is the difference?. Causation. Causation means that one thing causes another You hit your finger with a hammer so your finger swells. Your finger swelling is CAUSED by the hammer hitting it. Correlation.

Correlation vs. Causation
E N D
Presentation Transcript
Correlation vs. Causation What is the difference?
Causation • Causation means that one thing causes another • You hit your finger with a hammer so your finger swells. Your finger swelling is CAUSED by the hammer hitting it.
Correlation • Correlation is a concept from statistics that measures the relationship between two things. • A positive correlation means that when one thing goes up, the other goes too. • A negative correlation is the opposite, when one goes up, the other goes down
Can you tell the two apart? • The temperature outside and ice cream sales? • Correlation (they are related but hot weather doesn’t CAUSE ice cream sales to increase) • The number of firemen fighting a fire and the size of the fire? • Correlation (The bigger the fire, the more firemen; however, this doesn’t mean that bringing more firemen will cause the size of the fire to increase). • Not studying for a test and getting a low grade? • Correlation (they are related but you COULD make a good grade and not study, right?) • Exercising and burning calories? • Causation (burning calories is the RESULT of the exercise; in other words, exercising CAUSED you to burn calories)
Correlation Coefficients • Correlation coefficients are used in statistics to measure how strong a relationship is between two variables. • The value of r is such that -1 <r< +1. The + and – signs are used for positive linear correlations and negative linear correlations, respectively.
Positive, Negative or No • Positive correlation: If x and y have a strong positive linear correlation, r is closeto +1. An rvalue of exactly +1 indicates a perfect positive fit. Positive values indicate a relationship between x and y variables such that as values for xincreases, values for y also increase. • Negative correlation: If x and y have a strong negative linear correlation, r is close to -1. An rvalue of exactly -1 indicates a perfect negative fit. Negative values indicate a relationship between x and y such that as values for x increase, values for y decrease. • No correlation: If there is no linear correlation or a weak linear correlation, r is close to 0. A value near zero means that there is a random, nonlinear relationship between the two variables
Way More Info Than You Want: Correlation Coefficient, r : The quantity r, called the linear correlation coefficient, measures the strength and the direction of a linear relationship between two variables. The linear correlation coefficient is sometimes referred to as the Pearson product moment correlation coefficient in honor of its developer Karl Pearson. The mathematical formula for computing r is: where n is the number of pairs of data. (Aren't you glad you have a graphing calculator that computes this formula?)
Where do you find “r” on the calculator? • The correlation coefficient, r,will appear on the screen that shows the regression equation information • In addition to appearing with the regression information, the values r and r2 can be found under VARS, #5 Statistics → EQ #7 r and #8 r 2 .
Meaning of r values • A correlation greater than 0.8 is generally described as strong, whereas a correlationless than 0.5 is generally described as weak.
Describe as weak or strong and positive or negative • -0.4? • Weak negative (negative sign shows negative correlation and 0.4 is less than 0.5 so weak) • 0.9? • Strong positive (greater than 0.8 so strong) • -0.87? • Strong negative
Summary • The closer your correlation coefficient is to 1 or -1 the more linear your data will look when graphed. • When r = 1, the data would be perfectly linear with a positive slope • When r = -1, the data would be perfectly linear with a negative slope • The closer the r value gets to zero (from either direction, negative or positive), the weaker the correlation is. • When r= 0, there would be no correlation.