Download
1 / 21
210 likes | 318 Views
Learn how variables are related, differentiate correlation from causation, explore how common causes can influence outcomes, and grasp the significance of correlation coefficients like r. Discover the history of correlation measurement and its applications in different scenarios.

E N D
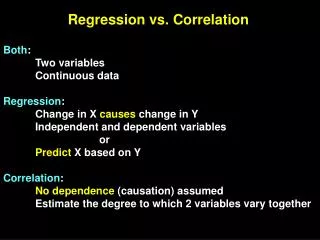
Now, a single datum is two values • Are variables related (associated)? – i.e., if one changes, is the other likely to change?
Statistical cliché: Association does not imply causation • Ex: Sleeping with one's shoes on is strongly correlated with waking up with a headache. Therefore, sleeping with one's shoes on causes headache. • (Or more likely, a common cause is drunkeness) • Ex: Study at U of PA Med Ctr, 1999: Young children who sleep with the light on are much more likely to develop myopia in later life. • (Later researchers found another common cause: Parents’ myopia.)
From Smithsonian Magazine, Aug ’98: • The Vermont Back Research Institute at the Univ of Vermont uses the “Vermont Disability Prediction Questionnaire” to predict whether a back problem will become disabling. Items include: • How many times have you visited a medical doctor in the past for back problems? • How many times have you been married? • How well do you get along with your coworkers? • Why do they ask these questions? Dr, Roland Hazard shrugs: “We don’t know.” It’s just that answers to such questions have proved predictive on whether back problems will become disabling. • I.e., they are related, but we don’t know how.
Which kinds of variables? • Both categorical: compare percentages • Ex: gender vs. physical activity (S ’06) • Input variable categorical: compare avgs • Ex: digital ratios • Both numerical • scatterplot (“correlation” and “regression”) • Ex: babyboom
Are these associations positive or negative? weak or strong?
Correlation (coefficient) r • Gives a measure of how closely points follow a straight line • Always between -1 and 1 • r = 1: all pts on a line with + slope • r = -1: all pts on a line with – slope • r near 0: blob • [Formula: turn x- and y-values into z-scores, multiply for each point, find avg product] • History: Invented by Karl Pearson (1857-1911)
“SD-line” [FPP only] • Okay, r measures how closely data follows a line. Which line? • through “point of averages” (x , y ) • slope: ±σy / σx ,where • sign is + if r > 0 , - if r < 0 • Ex: Baldness study: # hair (in 10K’s) avg 40, σ = 15; ages avg 36, σ = 20; r = -.3. If hair is on vertical axis, SD-line? • Ex: Scores on first exam avg 75, σ = 15; on final exam avg 110, σ = 35; r = .5. SD-line?
“Covariance formula” for r (FPP p.134) r = ((avg of xy) -xy)) /( σxσy ) Numerator is the “covariance of x and y”
Remarks on r • r is • a pure number (no units) • not affected by • reversing variables • linear changes of variables [changes of units, like ft to m]
r is affected by … • nonlinear association • outliers • combining different groups, with different centers (Simpson’s Paradox II) • “ecological correlations”, i.e., correlations of averaged data points • [examples shortly]
SAT scores Average scores from school districts in Cayuga, Madison, and Oswego counties for the 1998-99 school year Verbal / Math r = 0.770