Download
1 / 20
200 likes | 428 Views
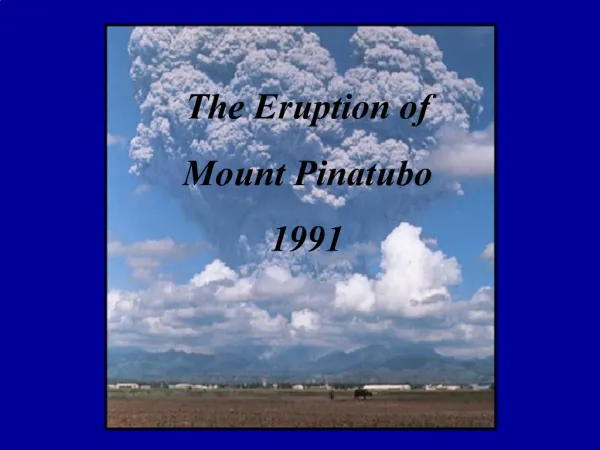
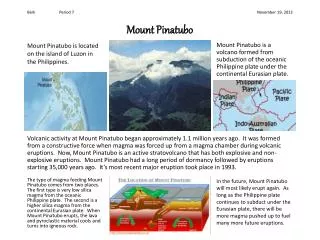
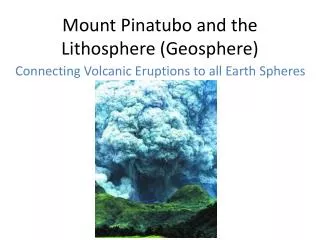
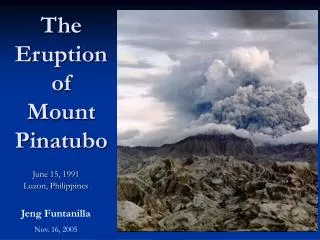
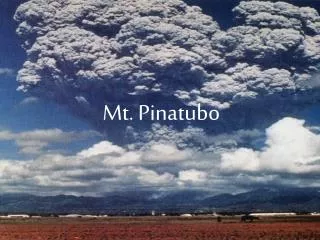
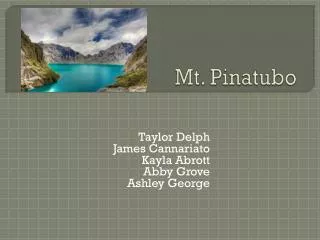
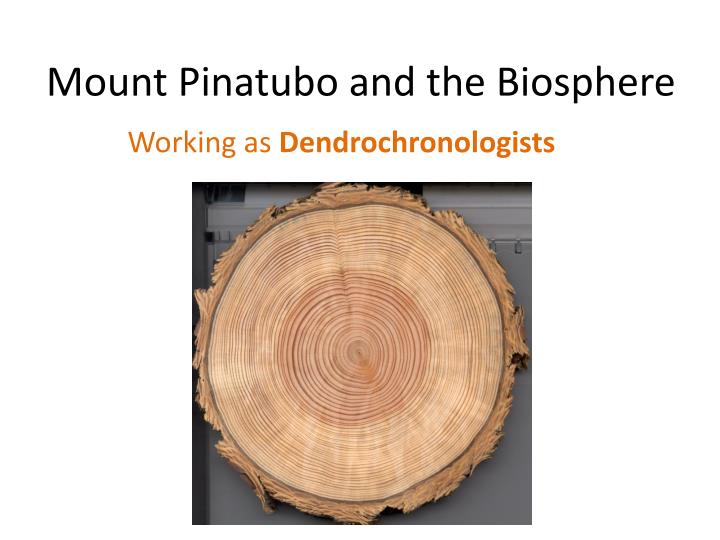
Mount Pinatubo and the Biosphere. Working as Dendrochronologists. Bell Ringer. Explain the scientific relationship between plate tectonics, earthquakes, and volcanoes. Open the file from your email:. Student Guide : Mount Pinatubo and the Biosphere. Figure Analysis.

E N D
Mount Pinatubo and the Biosphere Working as Dendrochronologists
Bell Ringer Explain the scientific relationship between plate tectonics, earthquakes, and volcanoes.
Open the file from your email: Student Guide: Mount Pinatubo and the Biosphere
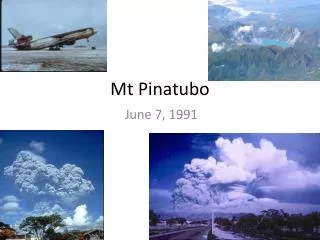
Figure Analysis • What do you notice about these pictures? • What words are familiar? • What words are unfamiliar? • How do you think this relates to the article you are about to read? Geology page 1 Going Global page 2
Background: Mt. Pinatubo and the Biosphere • Read pages 1 and 2 with your partner, switching after each paragraph. • You are looking for evidence to answer the two review questions at the end of page 2: • Identify Event-to-Sphere and Sphere-to-Sphere interactions • Explain the scientific relationship between plate tectonics, earthquakes, and volcanoes.
Bell Ringer • Review your EventSphere diagram from yesterday. • Identify one piece of evidence from the reading for each interaction.
Dendrochronology & Climate Peter Brown from Rocky Mountain Tree Ring Research explains dendrochronology and how we can use it to understand the climate. http://www.youtube.com/watch?v=oRYsAn5QLYo
Reading and Discussion • Read pages 3 and 4 with your partner. • Background – Tracking Historic Volcanoes • Trees and Volcanoes • Answer the following questions: • How do tree rings form? • What types of evidence can tree rings tell us about? • How can tree rings tell us about past and future climate change?
Working as a Dendrochronologist • Read the activity instructions at the top of page 5. • With a partner, review the What you know and What you want to find out information from page 5. • One person should have the tree ring image on the iPad and the other person should have the questions on their iPad. • One separate paper, answer theWhat you want to find out questions after reading the tree rings.
Bell Ringer (10 minutes) Complete your Dendrochronology analysis from yesterday (pages 5 & 6).
Extension – Volcanoes and Photosynthesis • Read page 7 as a class. • In groups, create a small poster of your assigned factor that influences this process. (10 minutes!) • Your poster should include: • TITLE • DRAWING • WRITTEN DESCRIPTION OF HOW THIS FACTOR INFLUENCES PHOTOSYNTHESIS • EACH GROUP WILL BRIEFLY PRESENT YOUR POSTER • Answer the Applying Your Understanding questions on separate paper
What is Photosynthesis? Photosynthesis is the process plants use to convert sunlight into energy. The rate of plant photosynthesis can be calculated, primarily by measuring the amount of oxygen produced by a plant. The plant takes in carbon dioxide, water, minerals and light, while producing oxygen. If global temperatures, seasons and precipitation change, the process of photosynthesis will be affected. How do you think that photosynthesis changes as the seasons change? Make a prediction about how photosynthesis might be affected after a volcanic eruption.
What do you see? • What do you wonder? • What might this mean? • What do you predict?
What do you see? • What do you wonder? • What might this mean? • What do you predict?
Applying Your Understanding Working in your groups, write responses (using complete sentences) to the questions for • Graph 1: page 8 • Graph 2: page 9 Note: As is the nature of science, the data tells the story and our first ideas may not match the story being told. This is an example in which scientists continue to go back and forth about the effect of Mt. Pinatubo’s eruption on photosynthetic activity on a global scale.
Bell Ringer: 10 minutes Based on our discussion from yesterday, and the overall trend of this graph, what do you predict happened to the concentration of CO2 in the next 10 years? What is your evidence for this?
Analyze Graph 2: Using the same steps that we took yesterday to analyze the first graph, complete your QEJ for Graph 2. (page 9 of the Student Guide)
Friday Expectations: 15 minutes: Working in your groups, write responses (using complete sentences) to the remaining questions for - • Graph 1: page 8 • Graph 2: page 9 5 minutes: Review and schedule for next week 15minutes: QUIZ
BARK Mt. Pinatubo and the Biosphere: QuizApplying Dendrochronology Skills THICK RINGS • Using evidence from this tree cross-section, make a prediction for how old this tree was when the volcanic eruption occurred. (Remember, each dark bold line represents 10 years of growth.) • How did this volcanic eruption impact photosynthesis? How does the evidence from the cross-section lead you to this conclusion? THIN RINGS CENTER