Download
1 / 9
110 likes | 380 Views
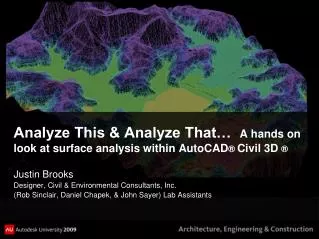
Analyze This & Analyze That… A hands on look at surface analysis within AutoCAD ® Civil 3D ®. Justin Brooks Designer, Civil & Environmental Consultants, Inc. (Rob Sinclair, Daniel Chapek, & John Sayer) Lab Assistants. Introduction . Types: Direction (aspect) Slopes Elevation

E N D
Analyze This & Analyze That… A hands on look at surface analysis within AutoCAD® Civil 3D ® Justin Brooks Designer, Civil & Environmental Consultants, Inc. (Rob Sinclair, Daniel Chapek, & John Sayer) Lab Assistants
Introduction Types: Direction (aspect) Slopes Elevation Slope arrows User-defined contours Contours Watersheds (water drop) Why surface analysis? • The data is already there • An engineers pie chart • More accurate checks on a 3D model What type of projects can it be used for • Site development: site assessment, site design, earthwork…. • Environmental: watershed restoration, subsurface investigation….. • Ecological: wetland mitigation, stream restoration, bathymetric…. • Waste management: landfill visual affects, annual disposal reports…
Agenda • Analysis basics – existing site assessment with analysis • Setting up a surface analysis style • Setting up a legend table style for an analysis • Use an analysis style and legend table to create a flood hazard map • Dynamic analysis – use analysis to assist in site design • Use Slope arrows to grade a site with slope restraints • Display watersheds and labels to show drainage points on site and areas draining to those points • Comparative analysis – extract data from a volume surface • Create a map displaying contours depicting cut and fill ranges • Render areas of cut and fill and use a legend table to extract the cut and fill volumes of these area • Tips and tricks with surface analysis • Erosion control blanket • Surface masking
Surface Style - Analysis Display • Turn on & off the analysis types • Most analyses take on the surface layer & display according to the ranges • Set layers for contours & watersheds Analysis • Scheme - sets a default color pattern to use (rainbow, reds, hydro, etc..) • Group by – determines how data will be divided into the set ranges • Display – 2D solid, hatch solid, mesh, or 3D face • Slope arrows – two additional settings, arrow type & arrow length
Surface Style – Analysis Watersheds • Types of watersheds – boundary, depression, flat, & multi-drain • Label style – label type of watershed, area, etc… • Set color & styles to watershed boundaries, hatches, target points, & segments Contours • Allows contours within different ranges to have different linetypes, lineweights ,& colors regardless of layer • Use color scheme – must be set to true for contours to be displayed as set in the analysis
Surface Properties – Analysis Analysis • Analysis edits made here only affect surface being edited • Analysis type – all analyses are setup under this tab • After an analysis is run on the surface it will be stored in the surface properties Ranges • Ranges number – sets number of ranges to run, this can be different from style, & can be edited & rerun as many time as needed • Run Analysis – select this button after desired number of ranges has been set • Range details window – here ranges and schemes can be modified in further detail
Surface Properties – Analysis Legend • Legend – a table linked to the analysis that lists & organizes surface data • Preview window – used to preview the legend table for the selected analysis Table style • Acts similarly to an AutoCAD table • To add or delete columns use the • Headers & column values can be edited with the text component editor (double click) • Column positions can be switched by simply clicking and dragging the header to its new location
Wrap Up • Questions or comments? Email me anytime and just mention AU jbrooks@cecinc.comor justin@pghcivil3d.com • Handout, datasets, and PowerPoint can be found on AU Online • If you would like one of videos of an exercise shown today please send me an email me and I’ll try my best to get it to you. • Remember to fill out the evaluations! • Enjoy the rest of your week!