Download
1 / 30
300 likes | 315 Views
This text explores the principles of acoustics in speech analysis, including distinguishing phonemes, determining speech patterns, and analyzing speech waveforms. It covers topics such as fundamental frequency, amplitude, spectrum, and timing, and introduces tools like Praat, Wavesurfer, and Xwaves for extraction and analysis. The text also discusses the production and perception of sound, complex periodic waves, power spectra, spectrograms, aperiodic waveforms, and the filtering of speech signals. Additionally, it highlights the various methods for capturing and storing speech signals for analysis.

E N D
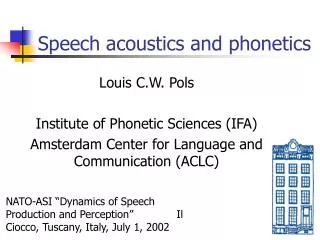
Acoustics of Speech Julia Hirschberg CS 4706
Goal 1: Distinguishing One Phoneme from Another, Automatically • ASR: Did the caller say ‘I want to fly to Newark’ or ‘I want to fly to New York’? • Forensic Linguistics: Did the accused say ‘Kill him’ or ‘Bill him’? • What evidence is there in the speech signal? • How accurately and reliably can we extract it?
Goal 2: Determining How things are said is sometimes critical to understanding • Forensic Linguistics: ‘Kill him!’ or ‘Kill him?’ • Call Center: ‘That amount is incorrect.’ • What information do we need to extract from the speech signal? • What tools do we have to do this?
Today and Next Class • Acoustic features to extract • Fundamental frequency (pitch) • Amplitude/energy (loudness) • Spectrum • Timing (pauses, rate) • Tools for extraction • Praat • Wavesurfer • Xwaves • …
Sound Production • Pressure fluctuations in the air caused by a musical instrument, a car horn, a voice • Sound waves propagate thru e.g. air (marbles, stone-in-lake) • Cause eardrum to move • Auditory system translates into neural impulses • Brain interprets as sound • Plot sounds as change in air pressure over time • From a speech-centric point of view, when sound is not produced by the human voice, we may term it noise • Ratio of speech-generated sound to other simultaneous sound:
How ‘Loud’ are Common Sounds – How Much Pressure Generated? Event Pressure (Pa) Db Absolute 20 0 Whisper 200 20 Quiet office 2K 40 Conversation 20K 60 Bus 200K 80 Subway 2M 100 Thunder 20M 120 *DAMAGE* 200M 140
Some Sounds are Periodic • Simple Periodic Waves (sine waves) defined by • Frequency: how often does pattern repeat per time unit • Cycle: one repetition • Period: duration of cycle • Frequency=# cycles per time unit, e.g. sec. • Frequency in Hz = cycles per second or 1/period • E.g. 400Hz pitch = 1/.0025 (1 cycle has a period of .0025; 400 cycles complete in 1 sec) • Zero crossing: where the waveform crosses the x-axis
Amplitude:peak deviation of pressure from normal atmospheric pressure • Phase: timing of waveform relative to a reference point
Complex Periodic Waves • Cyclic but composed of multiple sine waves • Fundamental frequency (F0): rate at which largest pattern repeats (also GCD of component frequencies) • Components not always easily identifiable: power spectrum graphs amplitude vs. frequency • Any complex waveform can be analyzed into a set of sine waves with their own frequencies, amplitudes, and phases (Fourier’s theorem)
Power Spectra and Spectrograms • Frequency components of a complex waveform power spectrum • Plots frequency and amplitude of each component sine wave • Picture • Obtained via Fourier analysis, Linear Predicative Coding (LPC),… • Useful for analysis and synthesis
Spectrograms • Add temporal dimension to the power spectrum • picture
Aperiodic Waveforms • Waveforms with random or non-repeatingpatterns • Random aperiodic waveforms: white noise • Flat spectrum: equal amplitude for all frequency components • Transients: sudden bursts of pressure (clicks, pops, door slams) • Flat spectrum with single impulse (click.wav) • Some speech sounds, e.g. many consonants (e.g. cat.wav)
Speech Waveforms • Lungs plus vocal fold vibration filtered by the vocal tract produce complex periodic waveforms • Cycles per sec of lowest frequency component of signal = fundamental frequency (F0) = physical correlate of pitch • Fourier analysis yields power spectrum with component frequencies and amplitudes • F0 is first (lowest frequency) peak • Harmonics are resonances of component frequencies amplified by vocal track
alveolar post-alveolar/palatal dental velar uvular labial pharyngeal laryngeal/glottal Places of articulation http://www.chass.utoronto.ca/~danhall/phonetics/sammy.html
Filtering • Acoustic filters block out certain frequencies of sounds • Low-pass filter blocks high frequency components of a waveform • High-pass filter blocks low frequencies • Band-pass filter blocks both around a band • Reject band (what to block) vs. pass band (what to let through) • But if frequencies of two sounds overlap…. source separation issues
How do we capture speech for analysis? • Recording conditions • A quiet office, a sound booth, an anachoic chamber • Microphones convert sounds into electrical current: oscillations of air pressure become oscillations of voltage in an electric circuit • Analog devices (e.g. tape recorders) store these as a continuous signal • Digital devices (e.g. computers,DAT) first convert continuous signals into discrete signals (digitizing)
File format: • .wav, .aiff, .ds, .au, .sph,… • Conversion programs, e.g. sox • Storage • Function of how much information we store about speech in digitization • Higher quality, closer to original • More space (1000s of hours of speech take up a lot of space)
Sampling • Sampling rate: how often do we need to sample? • At least 2 samples per cycle to capture periodicity of a waveform component at a given frequency • 100 Hz waveform needs 200 samples per sec • Nyquist frequency: highest-frequency component captured with a given sampling rate (half the sampling rate)
Sampling/storage tradeoff • Human hearing: ~20K top frequency • Do we really need to store 40K samples per second of speech? • Telephone speech: 300-4K Hz (8K sampling) • But some speech sounds (e.g. fricatives, /f/, /s/, /p/, /t/, /d/) have energy above 4K! • Peter/teeter/Dieter • 44k (CD quality audio) vs.16-22K (usually good enough to study pitch, amplitude, duration, …)
Sampling Errors • Aliasing: • Signal’s frequency higher than half the sampling rate • Solutions: • Increase the sampling rate • Filter out frequencies above half the sampling rate (anti-aliasing filter)
Quantization • Measuring the amplitude at sampling points: what resolution to choose? • Integer representation • 8, 12 or 16 bits per sample • Noise due to quantization steps avoided by higher resolution -- but requires more storage • How many different amplitude levels do we need to distinguish? • Choice depends on data and application (44K 16bit stereo requires ~10Mb storage)
But clipping occurs when input volume is greater than range representable in digitized waveform • Increase the resolution • Decrease the amplitude
How can we capture pitch contours, pitch range? • What is the pitch contour of this utterance? Is the pitch range of X greater than that of Y? • Pitch tracking: Estimate F0 over time as fn of vocal fold vibration • A periodic waveform is correlated with itself • One period looks much like another (cat.wav) • Find the period by finding the ‘lag’ (offset) between two windows on the signal for which the correlation of the windows is highest • Lag duration (T) is 1 period of waveform • Inverse is F0 (1/T)
Errors to watch for: • Halving: shortest lag calculated is too long (underestimate pitch) • Doubling: shortest lag too short (overestimate pitch) • Microprosody effects (e.g. /v/)
Sample Analysis File: Pitch Track Header • version 1 • type_code 4 • frequency 12000.000000 • samples 160768 • start_time 0.000000 • end_time 13.397333 • bandwidth 6000.000000 • dimensions 1 • maximum 9660.000000 • minimum -17384.000000 • time Sat Nov 2 15:55:50 1991 • operation record: padding xxxxxxxxxxxx
Sample Analysis File: Pitch Track Data (F0 Pvoicing Energy A/C Score) • 147.896 1 2154.07 0.902643 • 140.894 1 1544.93 0.967008 • 138.05 1 1080.55 0.92588 • 130.399 1 745.262 0.595265 • 0 0 567.153 0.504029 • 0 0 638.037 0.222939 • 0 0 670.936 0.370024 • 0 0 790.751 0.357141 • 141.215 1 1281.1 0.904345
Next Class • Tools for the Masses: Read the Praat tutorial • Download Praat from the course syllabus page and play with a speech file (e.g. http://www.cs.columbia.edu/~julia/cs4706/cc_001_sadness_1669.04_August-second-.wav or record your own) • Bring a laptop and headphones to class if you have them