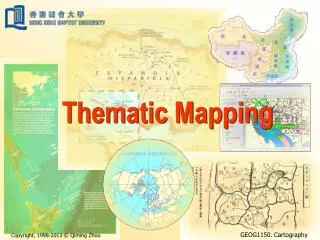
Thematic Mapping
Thematic Mapping. Thematic Mapping. Objectives of map design Data measurement Basic statistical concepts and processes Thematic map representations. Objectives of map design. Geographical variables are so diverse and complex, we must understand their essential nature.

Thematic Mapping
E N D
Presentation Transcript
Thematic Mapping • Objectives of map design • Data measurement • Basic statistical concepts and processes • Thematic map representations Thematic Mapping
Objectives of map design • Geographical variables are so diverse and complex, we must understand their essential nature. • Geographical ordering - locational relationships. • Discrete phenomena. • Continuous phenomena. Thematic Mapping
Data measurement • Scales of measurement • Nominal • Ordinal • Interval • Ratio • Use of the scales of measurement in thematic mapping Thematic Mapping
Nominal scales of measurement Examples of differentiation of point, line and area features on a nominal scale of measurement. After Robinson, et al., 1995 Thematic Mapping
Major Minor Smoke pollution Ordinal scales of measurement Examples of differentiation of point, line and area features on an ordinal scale of measurement. After Robinson, et al., 1995 Thematic Mapping
Interval-ratio scales of measurement Examples of differentiation of point, line and area features on an interval or ratio scale of measurement. After Robinson, et al., 1995 Thematic Mapping
Basic statistical concepts and processes • It is often necessary to manipulate raw data prior to mapping. • Pre-map data manipulation stage: • Making data to be mapped comparable. Thematic Mapping
Absolute and derived data • Absolute qualities or quantities: “raw data” maps showing landuse categories, production of goods, elevations above sea level, etc. • Derived values. • Summarisation or relationship between features. • Four classes of relationships: averages, ratios, densities and potentials. Thematic Mapping
Averages • Measures of central tendency • Three commonly used averages in cartography: • Arithmetic mean • Median • Mode Thematic Mapping
Arithmetic mean Arithmetic mean Geographical mean Thematic Mapping
Median and mode • Median - the attribute value in the middle of all ordered attribute values • Geographic median - the attribute value below which and above which half the total area occurs • Mode - the value that occurs most frequently in a distribution • Area modal class - the class which occupies the greatest proportion of an area Thematic Mapping
Ratios • Something per unit of something else • Quantities that are not comparable should never be made the basis for a ratio Thematic Mapping
Densities • Relative geographical crowding or sparseness of discrete phenomena Thematic Mapping
Potentials • Individuals comprising a distribution (e.g. people or prices) interact or influence one another. • The gravity concept: Thematic Mapping
Thematic map representations • Indices of variation • Mode - variation ratio • Median - quantile range (quartiles, ceciles or centiles (percentiles)) • Arithmetic mean - standard deviation Thematic Mapping
Scaling systems Thematic Mapping
Some basic statistical relations • Regression analysis • Correlation analysis • Spatial autocorrelation Thematic Mapping
Example Thematic Mapping (Source: Robinson, et al., 1995)
Regression analysis Scattergrams with fitted linear regression line. Thematic Mapping
Areal units Thematic Mapping
Observed, predicted and residuals Maps showing observed per capita educational expenditures, predicted per capita educational expenditures based on per capita income, and residuals from the regression. From Robinson, et al., 1995 Thematic Mapping
Observed, predicted and residuals (cont.) Maps showing observed numbers of first-degree graduates, predicted numbers of first-degree graduates based on per capita income, and residuals from the regression. From Robinson, et al., 1995 Thematic Mapping
Classification • Natural breaks • Equal interval • Equal area • Quartile • Standard deviation Thematic Mapping
Maximum = 30127 Minimum = 0 Mean = 291.3 Std = 1947.1 Example: world population density Thematic Mapping
Natural breaks Class 1 Class 2 Thematic Mapping
Natural breaks(cont.) Thematic Mapping
Equal interval Class 1 Thematic Mapping
Equal interval(cont.) Thematic Mapping
Equal area Class 3 Class 4 Class 5 Class 1 Class 2 Thematic Mapping
Equal area (cont.) Thematic Mapping
Quartile Class 1 Class 2 Class 3 Class 4 Class 5 Thematic Mapping
Quartile (cont.) Thematic Mapping
Standard deviation 0 - 1 Std -1 Std - 0 Mean Mean = 291.3 SD = 1947.1 Thematic Mapping
Mean +1 Std +2 Standard deviation Mean = 291.3 SD = 1947.1 Thematic Mapping