Download
1 / 25
250 likes | 388 Views
Young Lives Dataset and Data Visualisation: Challenges and Opportunities Caroline Knowles, Communications Manager Anne Yates, Data and Survey Manager Young Lives ESRC Research Methods Festival Oxford 8 July 2010. OVERVIEW OF PRESENTATION. What we do and how Study design Structure of data

E N D
Young Lives Dataset and Data Visualisation: Challenges and Opportunities Caroline Knowles, Communications Manager Anne Yates, Data and Survey Manager Young Lives ESRC Research Methods Festival Oxford 8 July 2010
OVERVIEW OF PRESENTATION • What we do and how • Study design • Structure of data • Round 3 potential • Research and analysis • How we can use the data • Some findings • Data visualisation • Why • Young Lives ‘virtual village’ • Next steps
YOUNG LIVES: A LONGITUDINAL STUDY OF CHILDHOOD POVERTY • Combines data collection, analysis and policy engagement • To improve understanding of the causes and consequences of childhood poverty • To improve policies and practice for children • 3 research themes: • Dynamics of poverty and uncertainty • Children’s education, schooling and time-use • Children’s well-being and experiences of poverty • All survey data available to other researchers (archived with ESDS) – and methodology being documented • Increasing power of data
A COLLABORATIVE PROJECT • Ethiopia: EDRI, Save the Children-UK, and qualitative team • India (Andhra Pradesh): CESS, SPMVV, and Save the Children-BRB • Peru: GRADE and IIN • Vietnam: CAF-VASS, GSO, and Save the Children-Vietnam • UK: ODID (University of Oxford), the Open University, Institute of Education (London), and Save the Children-UK • Plus long-term support of donors (DFID), Board(s) and stakeholders
WHAT WE DO • 12,000 children in 4 countries over 15 years • Two age cohorts in each country: • 2,000 children born in 2000-01 • 1,000 children born in 1994-95 • From infancy to parenthood • Pro-poor sample: 20 sites in each country selected to reflect country diversity, rural-urban, livelihoods, ethnicity etc; roughly equal numbers of boys and girls
STRUCTURE OF PANEL Ethiopia India Peru Vietnam YC (2,000) OC(1,000) Round 1(2002) 1 year old 8 years old Round 2(2006) 5 years old 12 years old Round 3(2009) 8 years old 15 years old Round 4(2012) 11 years old 18 years old Round 5(2015) 14 years old 21 years old
STRUCTURE OF QUANTITATIVE DATA Ethiopia India Peru Vietnam YC OC Community questionnaire Household questionnaire Child questionnaire Child questionnaire (except R1) Household questionnaire Self-administered questionnaire (R3) Caregiver questionnaire (R1)
TWO EXISTING ROUNDS OF PANEL DATA • Child, household and community level data • Household data: similar to other cross-sectional datasets (e.g. LSMS) but with questions to the caregiver on psychosocial competencies, social capital • Detailed time-use data for all family members • Child-level information on anthropometrics and from the caregiver • Child testing of cognitive achievement (language, maths) • Directly asking children! School and work, likes and dislikes, perceptions and aspirations • Complimented by 2 rounds of Qual data
THE THIRD ROUND OF DATA (2009) • Questionnaires change as children grow – they are now aged 8 and 15 • Self-administered questionnaire (older cohort) • More on educational history, psychosocial indicators, social capital • Focus on social protection, detailed modules on e.g. Productive Safety Net Programme in Ethiopia, in order to evaluate impact • Linking to existing data where possible – school data in India and Peru, job card in India (expanding issues/improving robustness) • School survey to complement existing data
RESEARCH AND ANALYSIS: WHAT CAN YOUNG LIVES DO? WHAT CAN’T WE DO? • Powerful tool for policy analysis • Can’t be used to monitor poverty • Mainly to focus on differences in access, impacts and outcomes across children, not communities • Looking at short- and long-run causes and consequences by exploiting longitudinal data and comparing cohorts over time • Can develop narratives – what are the mechanisms and channels for change (i.e. we know the impact of shocks, but what really happens and why) • Increasing value of dataset
NOT FOR MONITORING POVERTY Sampled children and communities, both in qualitative and quantitative samples: - not ‘statistically representative’ - but broadly representative of diversity in rural and urban population So we cannot monitor childhood poverty -x % of children in India live in poor families, or –y % are malnourished due to the food price increases -z % of schools have poor quality
BUT WE CAN ANALYSE CHILDHOOD POVERTY • e.g. x% of children living in the 25% poorest families go to schools of poor quality, while among the 25% richest families, this is only y% • So • Can be used to look at the causes and consequences of childhood poverty • Analyse poverty dynamics • Use to speak to other issues / countries / states
E.G. PERSISTING POVERTY IN VIETNAM Poverty persists in families with poorly educated parents Better-educated parents are more likely to escape poverty Example from Vietnam: entrenched poverty in some groups - Maternal education below primary is increasingly linked to extreme poverty – 2002 - 47% are in poorest fifth 2006 - 68% are in poorest fifth
POVERTY CYCLES BEGIN WITH EARLY NUTRITION • High prevalence of ‘stunting’ (low weight and height for age) in all 4 countries (23.4% to 30.8%) • Stunting is consistently higher in rural areas • Child nutrition is strongly linked to maternal and paternal education, regardless of family wealth • Poor child nutrition can impact on cognitive, educational and psychosocial outcomes
RELATIONSHIP BETWEEN STUNTING AND COGNITIVE DEVELOPMENT • Research for UNESCO GMR: relationship between stunting at 6-18 months (YC, R1) and cognitive test scores at age 4 to 5 (R2). By age 7 to 8, the disadvantage this creates is likely to be equivalent to the loss of a full term of schooling (Sanchez 2009) • Children from poorer families were up to one grade behind at age 12 in Ethiopia and Vietnam (OC, R2) (Dercon 2008) • Can also affect psychosocial outcomes: children’s sense of self-esteem, agency and respect they receive (Dercon 2008) • Potential for policy • Any long-term improvements across sample? Compare YC in R3 with OC in R1 (at same age, 7 to 8 years). And also have sibling data in R3 • Impact of food price crisis? Compare R2 data (2006) with R3 (2009)
THE IMPORTANCE OF EARLY EDUCATION • Pre-school enrolment: • - 94% in Vietnam • - 87% in Andhra Pradesh • - 84% in Peru • - 25% in Ethiopia (58% urban 4% rural) • In Andhra Pradesh • - Primary education enrolment = 73% (2006) • - Private sector = 36% of enrolment (and growing…) • Attraction of English-medium instruction • Quality – major issue (school survey)
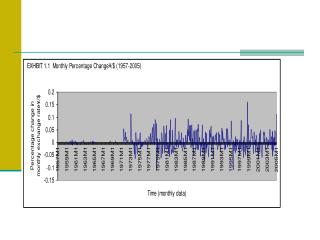
GROWTH OF THE PRIVATE SECTOR IN INDIA (PRE-SCHOOL / URBAN HOUSEHOLDS)
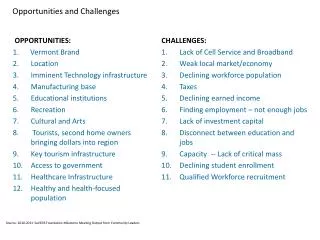
VIRTUAL VILLAGE • Goals of the Virtual Village • Communicate information • Aestheticand functional • Challenges • Balance between design and function • Deciding Themes/Key findings • Representing Urban/Rural • Four countries • Navigation/Format • Using aggregated data
VISITING THE VIRTUAL VILLAGE http://dh83.qeh.ox.ac.uk/younglives/virtual-village/
MOVING FORWARD • Modify Virtual Village • - Intro page for each icon • - Translate for country specific use • - Include videos • - Incorporate Round 3 data • Virtual Village in development education – tools for children / teaching materials • Incorporate Nesstar and graphical representation of Round 3 data on Young Lives website
FINDING OUT MORE… • www.younglives.org.uk • methodology • datasets (ESDS International) • publications • child profiles and photos • e-newsletter