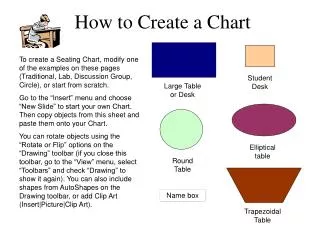
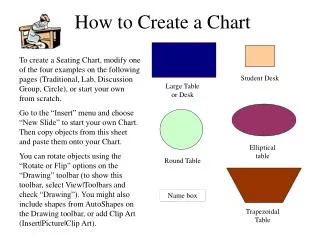
Download

1 / 4
40 likes | 394 Views
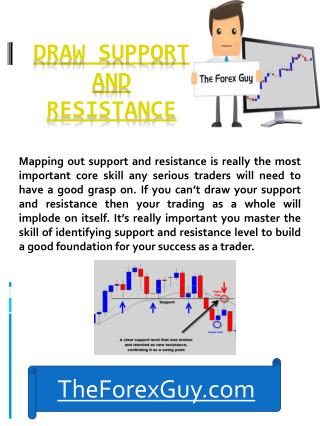
Get free support and resistance level for Nifty future and Bank Nifty future daily.In intraday support and resistance has an important role. It shows the trend in Index future. Fresh long or short position can be kept knowing intraday support and resistance levels in Nifty and Bank nifty.

E N D
How to Identify Support and Resistance levels on a Nifty chart
Support and Resistance in technical chart specifies area of supply and demand. Demand is an area in a technical chart where buyer volume is much greater than seller volume. This causes movement in stock or index in upward direction. Technically this is called Support. Supply is an area on a technical chart where seller volume is much greater than the buyer volume. Due to this stock or index go down. Technically it is called Resistance.
Take example Below given image is a snap shot of Nifty where Nifty Support and Resistance is explained. Here Nifty finds support @7520 where buyer take control and nifty moves up and a bullish trend starts, but when nifty reaches 7980, nifty reaches the overbought zone and profit booking starts there. Seller takes full control and nifty moves downward.
How to trade with Support and resistance? Swing Trader mostly use Nifty Support and Resistance to trade in index future or to know the index trend. Take above image of Nifty. Swing trader wait for trend reversal in any upward or downward trend. Let say in the image nifty touches lower Bollinger boundary near 7520 and it is also over sold zone. After conformation of trend swing trader take long position and wait till the overbought region which is near 7980. Here candle stick also reaching near the upper Bollinger boundary. Before upper Bollinger boundary or over bought zone trader book profits and square off the trade. Similarly in bearish trend trade can be initiated near over bought zone and square off near over sold zone. Doing trade using support and resistance loss can be minimized and profit can be earned.