
AIRS 2378
E N D
Presentation Transcript
Investigations with High Spectral Resolution Data from AIRSLectures in Maratea 22 – 31 May 2003 Paul MenzelNOAA/NESDIS/ORA
AIRS 2378 IASI 8461 HIRS 19 CrIS 1400
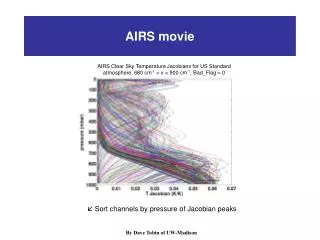
These water vapor weighting functions reflect the radiance sensitivity of the specific channels to a water vapor % change at a specific level (equivalent to dR/dlnq scaled by dlnp). Moisture Weighting Functions Pressure Weighting Function Amplitude Wavenumber (cm-1) UW/CIMSS The advanced sounder has more and sharper weighting functions
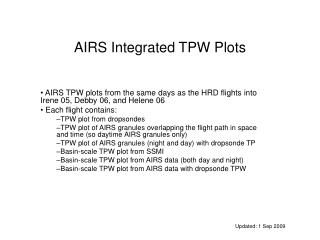
AIRS Spectra from around the Globe 20-July-2002 Ascending LW_Window
A correct description of the error structure in the IR spectral measurements is important for the solution of the atmospheric remote sensing inverse problem because: * errors, reinforced by the instability of the inverse problem, can drastically reduce the accuracy of the retrievals; * first guess moisture-temperature profiles are already quite accurate thus AIRS measurements must be of high quality to add new information; thus to make satellite soundings effective, measurement error structures have to be properly described; * to improve the relative signal to noise ratio of the AIRS measurements to the existing background first guess, the spatial structure of the measurements errors has to be correctly modeled, and measurements errors have to be filtered.
Spectral distribution of spatial smoothing filter (half-size given in pixel number)
Diagnostic tests for new data set • Spatial variability of radiances • Is upper atmosphere smoother than lower atmosphere? • Spectral variability of radiances • Are SW and LW channels with similar weighting • functions showing similar scenes? • (3) Noise of radiances • Can the noise be reduced with spatial averaging?
1 - StDev of bb measurement error [K] (RED), 2 - StDev of earth measurements [K] (BLUE); 3 - total atmospheric transmittance (BLACK) 2 3 1
Spatial distribution of 2555 – 944.1 [1/cm] measurements [K]
Optical properties of cloud particles: imaginary part of refraction index SW & LW channel differences are used for cloud identification {4 m - 11m}, {4.13 m - 12.6m}, and {4.53 m - 13.4m}
AIRS 2378 Transmittance within H20 absorption band
Atmospheric transmittance in H2O sensitive region of spectrum
Spatial distribution of 1370.2 – 1370.7 [1/cm] measurements [K]
Atmospheric transmittance in H2O sensitive region of spectrum
Spatial distribution of Ch 1534 at 1375.27 [1/cm] measurements [K]
Spatial distribution of 1385.02 – 1375.27 [1/cm] measurements [K]
Atmospheric transmittance in H2O sensitive region of spectrum
1365 to 1440 cm-1earth emitted spectrum 1417.5 1425 1432.5 1402.5 1410 1395 1380 1372.5 1387.5
Spatial distribution of Ch 1552 at 1385.02 [1/cm] measurements [K]
Spatial distribution of Ch 1553 at 1385.57 [1/cm] measurements [K]
Spatial distribution of Ch 1554 at 1386.11 [1/cm] measurements [K]
Spatial distribution of Ch 1555 at 1386.66 [1/cm] measurements [K]
Spatial distribution of Ch 1556 at 1387.21 [1/cm] measurements [K]
Spatial distribution of 1386.11 – 1386.66 [1/cm] measurements [K]
Spatial distribution of 1386.66 – 1387.21 [1/cm] measurements [K]
Spatial distribution of 1386.66 – 1387.21 [1/cm] measurements [K]
100 Advanced Sounder (3074) H2O spectral bands receive radiation from overlapping layers of the atmosphere Pressure (hPa) 1000 Moisture Weighting Functions High spectral resolution advanced sounder will have more and sharper weighting functions compared to current GOES sounder. Retrievals will have 2 to 3 x better vertical resolution. UW/CIMSS
AIRS 2378 Transmittance within CO2 absorption band
Atmospheric transmittance in CO2 sensitive region of spectrum
Earth emitted spectrum in CO2 sensitive 705 to 760 cm-1 CO2 Lines
Earth emitted spectrum 740 to 755 cm-1 CO2 Lines 745 746.25 748.75 750 747.5
Earth emitted spectrum 740 to 755 cm-1 CO2 Lines 745 746.25 748.75 750 747.5
0.1 Advanced Sounder (3074) CO2 spectral bands receive radiation from overlapping layers of the atmosphere Pressure (hPa) 1000 Temperature Weighting Functions High spectral resolution advanced sounder will have more and sharper weighting functions compared to current GOES sounder. Retrievals will have 3 to 4 x better vertical resolution. UW/CIMSS
UW CIMSS
Mt Etna eruption 28 October 2002 ISS photo 28 October 2002 MODIS Aqua