Download

1 / 15
150 likes | 266 Views
The LUCID project assesses climate impact of past/future land-cover changes using ARPEGE-Climat model in CNRM, Toulouse, France. Experimental data includes SST-based simulations with 1992/1870 land covers and detailed elements for analysis of temperature, precipitation, evaporation, and land surface changes. Focus on examining impact on extreme events using Stardex indices based on daily variables. Results show significant impact of historical land-use changes on climate extremes with noticeable effects on temperature distribution and moderate impact on evaporation and precipitation. Evaluation of compensation effects between evapotranspiration and bare soil evaporation across models. Conclusively, daily distribution analysis of precipitation and temperature extremes provides insights for climate change assessment in land-use scenarios.

E N D
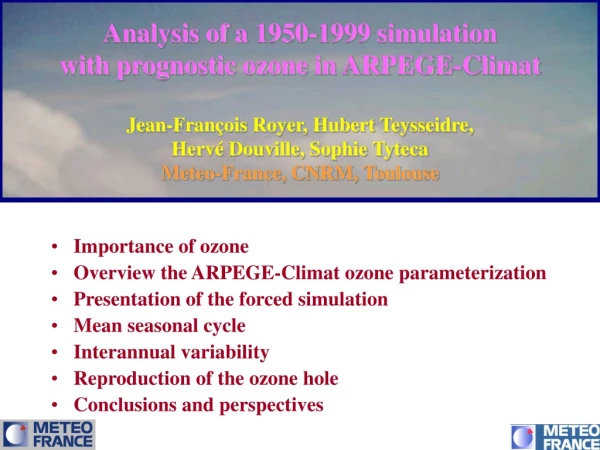
Impact of land use changes on extremes in the ARPEGE-Climat model (LUCID experiment) Aurore VOLDOIRE CNRM, Toulouse, France aurore.voldoire@meteo.fr
LUCID experiment • Aim of the LUCID project: Assessment of the impact of land-use changes on climate • For past and future land-cover changes • On a multi-model basis
Experiments performed in CNRM • What is currently available ? A pair of ensemble of simulations with prescribed SSTs • One with 1992 land cover • One with 1870 land cover Each simulation consists of 31 years using SSTs over the period 1971-2001. There are 5 elements for each case, each element differs by its initial conditions. • Which model is used in CNRM ? ARPEGE-Climat (v3) = the atmospheric component of CNRM-CM3 which has been used in IPCC simulations The land–surface scheme ISBA(Leaf Area Index -LAI- is prescribed)
Vegetation fraction in February Vegetation fraction in July Anomaly 1992-1870 Anomaly 1992-1870 Land cover maps Percentage of crop area (provided by N. DeNoblet) 1870 1992
Vegetation parameters aggregated on the model grid(1) Vegetation fraction February July
Vegetation parameters aggregated on the model grid(2) Vegetation albedo Soil depth
Impact on temperature and precipitations 2m Temperature Precipitations DJF Isolines = Student t-test 90% 95% 99% JJA
Impact on total evaporation Precipitation Evaporation DJF Isolines = Student t-test 90% 95% 99% JJA Relatively weak impact on hydrology in CNRM-CM3: Is it the same for other models? !!! Scale !!!
Regional land surface changes Crops25% 47% Forests 47% 26% Crops 10% 45% Forests 58% 26% Crops 1% 10% Grasslands 39% 45% Forests 48% 38% Crops8% 27% Grasslands 28% 21% Forests 63% 51% Bare Soil 68% 64% Grasslands 24% 27% Bare Soil 35% 25% Grasslands42% 53% Forests 17% 12%
Albedo LAI 2m temperature m2/m2 °C Snow 1870 1992 1992-1870 Vegetation fraction Anomaly 1992-1870 kg.m-2 % US Great Plains: impact on monthly mean climate
Precipitation Bare soil evaporation LAI Soil Wetness Index mm.d-1 mm.d-1 m2/m2 % Snow + 1870 1992 1992-1870 Evapotranspiration Vegetation fraction Total evaporation kg.m-2 mm.d-1 = % mm.d-1 US Great Plains: impact on monthly mean climate ISBA simulates a change in evapotranspiration, but it is partly compensated by an increase in bare soil evaporation Anomaly 1992-1870
Impact on daily variability and severe events • It has been shown in the case of tropical deforestation that land-use changes have a noticeable impact on daily variability(Voldoire and Royer, 2004, Clim. Dyn.) • In the LUCID experiment, we propose to calculate Stardex indices as in IPCC simulations (Frich et al., 2002, Clim. Res.) Theses indices are based on daily P, Tmoy, Tmin and Tmax. • Maximum number of consecutive dry days • Precipitation intensity • Number of days with P>10mm.d-1 • Number of frost days • Quantiles of Tmin and Tmax • …..
Tmin quantile 10% 2m temperature Tmax quantile 10% °C °C °C Spread of the anomaly 1992-1870 1870 1992 1992-1870 Tmax quantile 90% Number of frost days Tmin quantile 90% °C °C US Great Plains: impact on extremes? (1) temperature
Precipitation intensity Precipitation mm.d-1 mm.d-1 Number of days with P>10mm.d-1 1870 1992 1992-1870 Maximum number of consecutive dry days US Great Plains: impact on extremes? (2) precipitations
Conclusion • The impact of past land-use changes is the most noticeable • Over mid-latitudes • On temperature (snow masking effect of vegetation = –2°C in winter) • The impact on evaporation and precipitation is relatively weak • Because in ARPEGE-Climat the reduction in evapotranspiration is compensated by an increase in evaporation from bare soil. • Is this compensation realistic? Do the other models involved in LUCID produce the same effect? • Land-use changes have an impact on the daily distribution of precipitations and temperatures. Stardex indices appear as a good candidate to assess this question we propose to calculate these indices in all the LUCID experiments. Need to store daily Tmin, Tmoy, Tmax and P.