Download
1 / 16
160 likes | 276 Views
Estimating % Power using Flight Test Data, Thrust HP, and Equivalent Flat Plate Drag. Objective. The Objective is to generate a Chart that relates: RPM % Power Output True Airspeed Fuel Flow Range Cruise Altitude. Methodology.

E N D
Estimating % Power using Flight Test Data, Thrust HP, and Equivalent Flat Plate Drag
Objective • The Objective is to generate a Chart that relates: • RPM • % Power Output • True Airspeed • Fuel Flow • Range • Cruise Altitude
Methodology • Gather Flight Test Data for a variety of RPM settings (WOT thru economy cruise) • For each RPM, record True Airspeed (TAS) at SL, 4000’ and 8000’ density altitude • Calculate % Pwr for S.L. data • Use the relationship between Density Altitude (DA) and Power Available to estimate % Pwr for 4000’ and 8000’
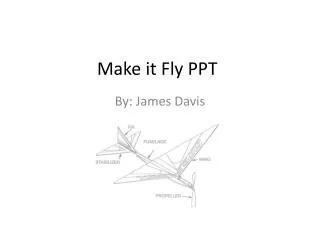
Assumptions • Max BHP = 77 HP • I don’t think I’m getting 80 HP based on my maximum RPM of 3300 • Prop Efficiency = 75% • Equivalent Flat Plate Area (fe) remains constant • Changes in TAS are due to changes in engine power (% Pwr) • Fuel Flow is proportional to % Pwr
130 RPM = 3300, TAS = 130 mph % Pwr = 100% 130 mph & 58 THP intersect at fe=4 sq ft 58 THP = 77 BHP * 0.75 = 58
RPM = 3200, TAS = 125 mph 125 50 58 % Pwr = 50/58 = 86%
RPM = 3100, TAS = 120 mph 45 58 % Pwr = 45/58 = 77%
RPM = 3000, TAS = 115 mph 115 40 58 % Pwr = 40/58 = 70%
RPM = 2900, TAS = 110 mph 110 35 58 % Pwr = 35/58 = 60%
RPM = 2800, TAS = 105 mph 105 58 32 % Pwr = 32/58 = 55%
Findings • Equivalent Flat Plate Area (Fe) = 4 sq. ft. • RPM TAS % Pwr • 3300 130 1.00 • 3200 125 0.87 • 3100 120 0.77 • 3000 115 0.70 • 2900 110 0.60 • 2800 105 0.55
Findings (cont) • Measured WOT Fuel Flow = 5.7 gph • Calculate fuel flow based on % Pwr • RPM TAS % Pwr Fuel Flow • 3300 130 1.00 5.7 • 3200 125 0.87 5.0 • 3100 120 0.77 4.4 • 3000 115 0.70 4.0 • 2900 110 0.60 3.4 • 2800 105 0.55 3.1
Findings (cont) • Power Output falls with DA • At 4000’ DA, max power output is 87% of S.L. output • At 8000’ DA, output is 77% of S.L.
Conclusion • From here, we can do the math and complete the % Power Table