Warfarin
Warfarin. Anticoagulant : Blood thinner Efficacious for preventing thromboembolism (TE) (blood clot inside a blood vessel) Over-anticoagulation: Major bleeds Under-anticoagulation: lost efficacy – TE

Warfarin
E N D
Presentation Transcript
Warfarin • Anticoagulant : Blood thinner • Efficacious for preventing thromboembolism (TE) (blood clot inside a blood vessel) • Over-anticoagulation: Major bleeds • Under-anticoagulation: lost efficacy – TE • The management goal is to dose patients so that side effects from over- or under-anticoagulation are minimized.
INR measures anticoagulation level • INR: International Normalized Ratio. • The ratio of the time taken for a patient’s blood to clot compared with a normal person who will have an INR of 1. • Acceptable therapeutic range is 2-3 for most, but not all, conditions. • High INR: Over-anticoagulation. • Low INR: Under-anticoagulation.
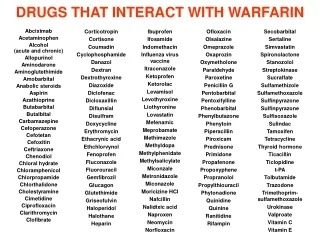
Source of Variability in Warfarin dose requirements • Many clinical and environmental factors can influence warfarin response. E.g. age, gender, race, height, weight, concomitant medications, foods (Vitamin K), herbal ingestion etc. • Despite knowledge of these factors, a large proportion of variability in warfarin dose requirements remains uncertain.
Genetic Factors • One possible reason is that genetic factors play an important role in warfarin response. • CYP2C9: Warfarin Pharmacokinetics. • VKORC1: Warfarin Pharmacodynamics.
Underlying assumption • The more quickly a patient receives his maintenance dose, the lower the risk of over- or under-anticoagulation. • If the 1st dose is close to the maintenance dose, the time and variability to reach the maintenance dose will be shorter and smaller respectively. • The use of genetics will yield the 1st dose closer to the maintenance does than using clinical information alone.
COAG Clinical Trial • A multicenter, double-blinded, stratified RCT comparing two approaches: 1) initiation of first dose of warfarin therapy based on algorithms using only clinical information and 2) initiation of first dose of warfarin therapy based on algorithms using clinical information and an individual’s genotype using genes known to influence warfarin response
Study Endpoint • Percentage of time participants spend within the therapeutic INR range (PTTR) during the first four weeks of therapy (using linear interpolation, Rosendaal et al.). • PTTR is a measure of over- and under- AC and improving AC control can reduce complications and cost (surrogate). Rosendaal et al. (1993) Thrombosis and Haemostasis, 69,236-239
Analysis and Sample size • Primary analysis • Heterogeneous study population in terms of warfarin response • Use of prospective allocation to incorporate targeted group into primary analysis • Development of optimal allocation
Primary analysis • Analysis of the primary outcome will be done by intention-to-treat, comparing the PTTR using a linear model including stratification variables. • Stratification will be done by sites (12 sites) and race: trial dosing algorithm predicts dose differently for AA and non-AA.
Important Subgroup in COAG • Baseline predicted doses from two algorithms will be very similar for “average” patients – no expected Tx effect on PTTR. • For patients with larger differences between the two algorithms – Greater Tx effect on PTTR • A clinically important dose difference between two predicted doses is defined as 1mg/day (20% from 5mg/day, a national average).
Subgroup Analysis in COAG • Targeted design: When a subpopulation likely to benefit has been identified and an accurate assay is available for practical use for selecting such patients (Maitournam and Simon, 2004; Suman et al., 2008). • COAG: • Instead of recruiting only the subgroup, we prospectively consider a formal subgroup analysis as part of primary analysis.
Prospective alpha allocation • Prospective alpha allocation (Moyé, 2000; Moyé and Deswal, 2001; Sargent et al., 2005; Freidlin and Simon, 2005, Wang et al., 2007) • Both full cohort and subgroup analyses are considered primary by using 0.04 and 0.01 of alpha, experiment-wise type I error. • 0.04 is arbitrary (Freidlin and Simon, 2005) Optimal alpha allocation.
Prospective alpha allocation (cont.) • Bonferroni correction is unnecessarily conservative especially when there is a positive correlation. • Based on the correlation between full cohort and subgroup analyses, we can use alpha larger than 0.01 for the subgroup.
Sample Size and Power in COAG • PTTRc=0.4*73%+0.6*61% = 65.8% • PTTRg=0.4*73%+0.6*61%*(1+0.15)=71.3% • where PTTRc = PTTR in clinical algorithm • PTTRg = PTTR in genetic algorithm • 15% treatment effect only in the subgroup with low PTTR. • 10% drop out, standard deviation = 25%
Sample Size and Power in COAG (cont.) • 90% power to detect 5.5% PTTR difference assuming 10% drop-out rate at • Total sample size of 1238. • When p=0.6, the sample size of the subgroup is 742. It provides over 97% power for the subgroup analysis at even Too much waste? optimal alpha allocation in the next page.