Download
1 / 60
600 likes | 659 Views
Bellringer. Compare and explain in complete sentences what is distance. Previous homework. Graph your motion: distance, velocity, and acceleration for your travel on a bus/car from home to school and back. Homework.

E N D
Bellringer Compare and explain in complete sentences what is distance.
Previous homework Graph your motion: distance, velocity, and acceleration for your travel on a bus/car from home to school and back
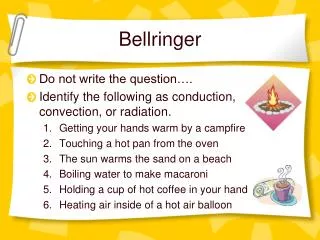
Homework CALCULATE DISTANCE, VELOCITY AT ANY TIMEFOR THE ARROW SHOOT VERTICALLY IN THE AIR
Graphing Motion Every Picture Tells A Story
Position Time Graphs of Accelerated motion Position vs. time graphs give you an easy and obvious way of determining an object’s displacement at any given time, and a subtler way of determining that object’s velocity at any given time.
A very useful aspect of these graphs is that the area under the v-t graph tells us the distance travelled during the motion.
Since the slope represents the speed, if the speed is increasing over time, the slope must be also be increasing over time. The graph is a curve that gets steeper as you move along The x-axis. A position-time graph for a ball in free fall is shown below.
The graph of an object slowing down is also cuved. The example below show the position-time graph for a car coming to a gradual stop at a red l ight. As time passes, the car’s speed decreases. The slope must therefore decrease.
Velocity vs Time Graphs slope = velocity d t slope = acceleration v area = distance t a area = velocity t
If the graph is a horizontal line, there is no change in velocity, therefore there is no acceleration (the slope is 0). If the acceleration is positive then the slope is positive (the line moves upward to the right). If the acceleration is negative, then the slope is negative (the line moves downward to the right).).
An object is moving in the positive direction if the line is located in the positive region of the graph (whether it is sloping up or sloping down). An object is moving in the negative direction if the line is located in the negative region of the graph (whether it is sloping up or sloping down). If a line crosses over the x-axis from the positive region to the negative region of the graph (or vice versa), then the object has changed directions.
The object moves in the + direction at a constant speed - zero acceleration (interval A). The object then continues in the + direction while slowing down with a negative acceleration (interval B). Finally, the object moves at a constant speed in the + direction, slower than before (interval C).
The object moves in the + direction while slowing down; this involves a negative acceleration (interval A). It then remains at rest (interval B). The object then moves in the - direction while speeding up; this also involves a negative acceleration (interval C).
The object moves in the + direction with a constant velocity and zero acceleration (interval A). The object then slows down while moving in the + direction (i.e., it has a negative acceleration) until it finally reaches a 0 velocity (stops) (interval B). Then the object moves in the - direction while speeding up; this corresponds to a - acceleration (interval C).
a plot of velocity versus time can also be used to determine the displacement of an object. The diagram below shows three different velocity-time graphs; the shaded regions between the line and the time-axis represents the displacement during the stated time interval.
The velocity-time graph for a two-stage rocket is shown below. Use the graph and your understanding of slope calculations to determine the acceleration of the rocket during the listed time intervals. When finished, click the buttons to see the answers. 20 m/s2 40 m/s2 -20 m/s2
Acceleration • Acceleration – the rate at which velocity is changing • Acceleration = ∆v/ ∆t • Can increase or decrease (sometimes called deceleration) • Think of traveling in a car, you can feel the acceleration • 3 ways to accelerate in a car • Brake pedal—slowing down; coming to a stop (changing speed) • Steering wheel—going around a corner or curve (changing direction) • Gas pedal—leaving from a stopped position (changing speed)
The object moves in the + direction at a constant speed - zero acceleration (interval A). The object then continues in the + direction while slowing down with a negative acceleration (interval B). Finally, the object moves at a constant speed in the + direction, slower than before (interval C).
The object moves in the + direction at a constant speed - zero acceleration (interval A). The object then continues in the + direction while slowing down with a negative acceleration (interval B). Finally, the object moves at a constant speed in the + direction, slower than before (interval C).
The object moves in the + direction while slowing down; this involves a negative acceleration (interval A). It then remains at rest (interval B). The object then moves in the - direction while speeding up; this also involves a negative acceleration (interval C).
Zero to 90s - On this graph we see a horizontal line that reads “5m/s” for those same first 90 seconds. • On a v-t graph a flat line means constant velocity. Constant velocity means zero acceleration.
Graphs of Motion—Uniform Velocity • The area under a velocity vs time graph is the displacement of the object. • Find the distance traveled by each object.
Acceleration • Suppose you are traveling in a car and your speed goes from 10.km/h to 60.km/h in 2.0s. What is your acceleration? • Suppose a car goes from 80.km/h to 15km/h in 5.0 seconds. What is the acceleration? • A car is coasting backwards down a hill at a speed of 3.0m/s when the driver gets the engine started. After 2.5s, the car is moving uphill at 4.5m/s. Assuming that uphill is in the positive direction, what is the car’s average acceleration?
Graphs of Motion • Velocity vs time graphs: How can you tell if the object is accelerating or decelerating? • Accelerating (speeding up) – when the magnitude of the velocity is increasing • Decelerating (slowing down) – when the magnitude of the velocity is decreasing
Stage 1: The car moves forwards from the origin to in the first 5 s.
Stage 2: The car moves backwards, passes the origin, to in the next 5 s.