TERAS analysis update
110 likes | 217 Views
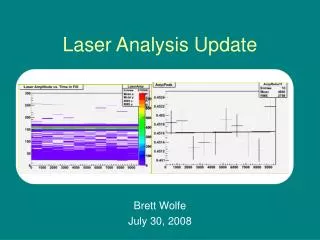
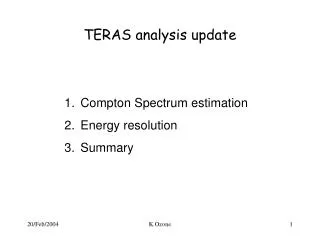
TERAS analysis update. Compton Spectrum estimation Energy resolution Summary. Why so broad?. In terms of energy resolution at the Compton edge (approx. 40MeV monochro.), we obtain an energy resolution of 11.8% in FWHM. FWHM=11.8%.

TERAS analysis update
E N D
Presentation Transcript
TERAS analysis update • Compton Spectrum estimation • Energy resolution • Summary K.Ozone
Why so broad? In terms of energy resolution at the Compton edge (approx. 40MeV monochro.), we obtain an energy resolution of 11.8% in FWHM. FWHM=11.8% It is not consistent with the result (FWHM~4.5% for 55MeV) estimated in CEX beam test. The absorption length is long enough and PMT outputs were stable during the test. We can guess something was wrong with the incident beam spectrum. K.Ozone
Parameters in LCS beam - Most of parameters are measured and estimated . - Electron bunch size is not determined. - We may have located collimator(s) apart from the beam axis. K.Ozone
Compton spectrum estimation Horizontal bunch size 1.55 mm 1.88 mm 2.2 mm These are not so difference. This time this parameter is fixed at 1.88mm. The most sensitive factor is displacement. It was possible that collimators were shifted for some reasons. Actually the resolution would be too bad unless a certain displacement was assumed. K.Ozone
Fit to estimate it The fitting function is a convolution of a response function with various Compton spectra. Response function Compton spectrum - Bunch size is fixed. - The displacement of collimator ranges from 0.0 mm to 3.6 mm. 0.0mm Fitting result in MC 2.0mm 3.0mm Monochromatic 40MeV gamma 3.6mm Gamma-ray Energy [MeV] K.Ozone
Compton spectrum estimation Dspl:=displacement When the displacement becomes a few mm (right figures), chi2/ndf becomes smaller. However the others wasn’t fitted well (see below). Right-side widths are almost same ~1%. Dspl =3.3mm FWHM=2.8(=1.8+1.0)% Chi2/ndf=1.03 Dspl =2.4mm FWHM=5.8(=4.8+1.0)% Chi2/ndf=1.99 Dspl =3.6mm FWHM=3.2(=2.2+1.0)% Chi2/ndf=6.67 Dspl =3.4mm FWHM=2.5(=1.6+0.9)% Chi2/ndf=1.44 Dspl =0.0mm FWHM=11.8(=10.3+1.5)% Chi2/ndf=2.52 K.Ozone
Compton spectrum estimation ndf = 25 Error bar: fitting error Displacement in X/Y was between 0.0 mm to 3.4 mm. That is, the upper limit is 3.4 mm. K.Ozone
Energy resolution Center of the front face Event selection 5 4 3 2 1 Center of the PMT • - 10 points • Compton (<40MeV) events 5 slice cuts by sigma2(D) Energy resolution is estimated, assuming the displacement is less than 3.4 mm conservatively. It requires Chi2/ndf < 2.0. K.Ozone
Dspl=2.2~2.8mm Result (slice cut) Dspl=1.8~2.4mm Dspl=2.2~3.2mm In every cases, right widths are 3% down to 1% as below. Dspl=2.4~2.8mm Dspl=1.8~2.6mm Dspl=2.2~2.8mm Dspl=1.8~2.6mm Dspl=1.8~2.2mm Dspl=1.4~2.2mm Dspl=1.8~2.6mm K.Ozone
Error evaluation • Collimator displacement: error bars shown in figures. • Electron bunch size: 0.3% • Gain determination: <3% • QE: Not corrected. • Total noise(pedestal): <1% against 30,000 p.e. • Fitting results include 3., 4., and 5. The most dominant factor is uncertainty of the collimator displacement. K.Ozone
Summary • It is reasonable to suppose that collimators were shifted by a few mm. However it was not realistic because we by measuring counting rate. The 1st collimator may have been shifted a bit. • The energy resolution (FWHM) is expected to be less than 4% if D>45. It is almost the same as results in CEX beam test. • In this analysis energy resolutions are estimated. It is found that higher tail of the spectrum is sharp enough. K.Ozone