Download

1 / 19
190 likes | 271 Views
Learn how to interpret measures of center such as mean, median, and mode with examples and calculations. Discover the concepts behind these statistical measures and how to apply them in practical situations.

E N D
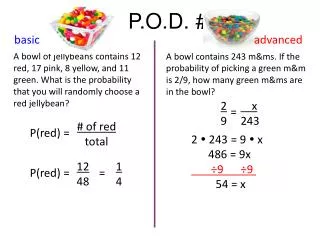
P.O.D. #1 basic advanced 256 ÷ 4 = 64 482 ÷ 8 = 60.25
Mean • The sum of the data divided by the number of items in the data set. • Usually thought of as the average. Example: Julie’s score on the math tests this year are 85, 67, 92, 50, 100, and 92. Mean = (85 + 67 + 92 + 50 + 100 + 92) 6 = 486 6 = 81
Median • The value appearing at the center of a sorted list. • Numbers must be written in order from least to greatest. • If the set has two numbers in the middle, you add the 2 numbers and divide by two to find the median. Example: Julie’s score on the math tests this year are 85, 67, 92, 50, 100, and 92. 50, 67, 85, 92, 92, 100. Median = 85 + 92 2 = 177 2 = 88.5
Mode • The value that occurs most often. • A data set can have no mode, one mode, or more than one mode. Example: Julie’s score on the math tests this year are 85, 67, 92, 50, 100, and 92. 50, 67, 85, 92, 92, 100. Mode = 92
Whiteboard: Find the mean of the following set: 6 , 2 , 3 , 8 , 9 , 7 , 8 , 4 , 7 (6 + 2 + 3 + 8 + 9 + 7 + 8 + 4 + 7) 9 = 54 9 = 6
Whiteboard: Find the median of the following set: 5 , 3 , 7 , 8 , 7 , 6 3, 5, 6, 7, 7, 8 Median = 6 + 7 2 = 13 2 = 6.5
Whiteboard: Find the mode of the following set: 3 , 9 , 3 , 7, 4 , 9 , 3 , 7 , 4, 7, 11 3, 3, 3, 4, 4, 7, 7, 7, 9, 9, 11 Mode = 3 and 7
Whiteboard: A weather station created this table to show the number of days over 70°. Find the mean number of days above 70°. (12 + 6 + 8 + 13 + 14 + 3 + 14) 7 = 70 7 = 10
Whiteboard: A weather station created this table to show the number of days over 70°. Find the median number of days above 70°. 3, 6, 8, 12, 13, 14, 14 Median = 12
Whiteboard: A weather station created this table to show the number of days over 70°. Find the mode. 3, 6, 8, 12, 13, 14, 14 Mode = 14
Whiteboard: A weather station created this table to show the number of days over 70°. If you were trying to convince a friend that it was an especially warm summer, which measure of center would you use? Mean = 10 Median = 12 Mode = 14
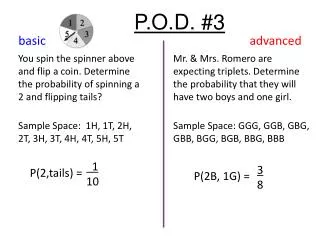
P.O.D. #2 basic advanced Mrs. Sprinkles class received the following scores on their last quiz: 12, 18, 14, 19, 20, 19 What score would the next student need to receive to make the mean score 18? Mrs. Sprinkles class received the following scores on their last quiz: 12, 18, 14, 19, 20, 19 Find the mean, median, and mode of the scores. 102 + x 7 Mean- 17 Median- 18.5 Mode- 19 = 18 X = 24
Range is the difference between the largest and the smallest value in a set of data. 13, 18, 13, 14, 13, 16, 14, 21, 13 The largest value in the list is 21, and the smallest is 13, so the range is 21 – 13 = 8.
Whiteboard: Find the range of the following set: 3 , 9 , 3 , 7, 4 , 9 , 3 , 7 , 4, 7, 11 11 − 3 = 8
Whiteboard: A weather station created this table to show the number of days over 70°. Find the range of the data. 14 − 3 = 11
Measures of Center Fortune Teller/ Cootie Catcher
Outside Corners: include brief definition • mean • median • mode • range Inside: 8 sets of data (5 or 6 numbers each) • Inner Flap- answer key for each set of data • mean • median • mode • range