Download

1 / 7
70 likes | 210 Views
Vincent Van Gogh once said, “If you hear a voice within you say, ‘You cannot paint,’ then by all means, paint and that voice will be silenced.” This powerful quote serves as a reminder for artists to push through self-doubt and embrace their creative instincts. In this exploration of Van Gogh's wisdom, we encourage artists of all levels to create fearlessly. Additionally, learn how to represent data visually using box-and-whisker plots, an essential skill for analyzing and displaying data effectively.

E N D
If you hear a voice within you say “you cannot paint,” then by all means paint and that voice will be silenced. –Vincent Van Gogh
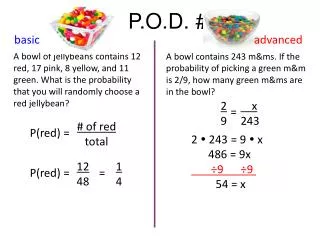
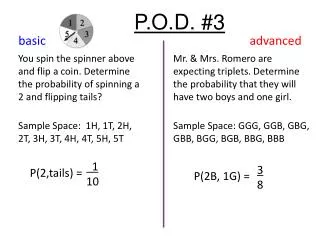
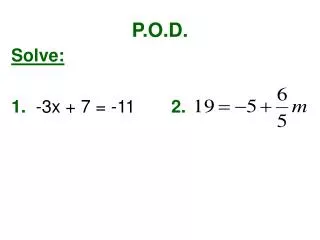
P.O.D. #5 basic advanced {3, 5, 1, 9, 2, 4, 3, 3, 6, 11, 12} {1, 2, 5, 9, 2, 4, 3, 3, 6, 11, 12, 8} 1, 2, 3, 3, 3, 4, 5, 6, 9, 11, 12 1, 2, 2, 3, 3, 4, 5, 6, 8, 9, 11, 12 Q1 = Q2 = Q3 = IQR = 3 4 9 6 Q1 = Q2 = Q3 = IQR = 2.5 4.5 8.5 6
Representing Data with a Box-and-Whisker Plot Lowest number Highest number Q1 Q2 Q3
Example: Find Q1, Q2, Q3, and the lowest and highest numbers in the data set. Lowest value = 4.5 Q1 = 8.5 Q2 (median) = 12 Q3 = 14 Highest Value = 20
Example: Draw a box and whisker plot for the follow data set: 5, 2, 16, 9, 13, 7, 10. 2, 5, 7, 9, 10, 13, 16 Low = Q1 = Q2 = Q3 = High = 2 5 9 13 16
Whiteboard: The box plot below shows the monthly spending of a group of 120 students on their cellphones. Lowest value = 4 Q1 = 20 Q2 (median) = 24 Q3 = 36 Highest Value = 40
Whiteboard: Create a box-and-whisker plot for the following data: 1, 23, 4, 12, 16, 24, 9. 1, 4, 9, 12,16, 23, 24 Low = Q1 = Q2 = Q3 = High = 1 4 12 23 24