Download
1 / 1
10 likes | 169 Views
2008/06/30. 2007/06/28 showing. 2007/06/28. Database delineation. Database 2007-8 Deforestation. FBD channels. HH. HV. HH/HV. 10 km. Comparison of FBD and ScanSAR deforestation detections. Martin Whittle (a) , Shaun Quegan (a) ,Kokok Yulianto (b) and Yumiko Uryu (b)

E N D
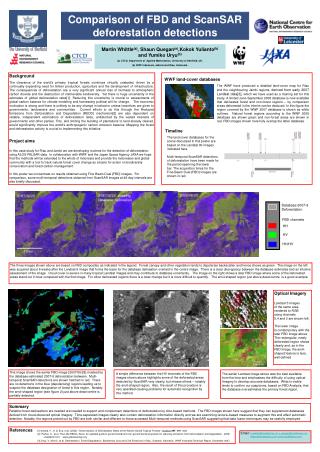
2008/06/30 2007/06/28 showing 2007/06/28 Database delineation Database 2007-8 Deforestation FBD channels HH HV HH/HV 10 km Comparison of FBD and ScanSAR deforestation detections Martin Whittle(a), Shaun Quegan(a),Kokok Yulianto(b) and Yumiko Uryu(b) (a) CTCD, Department of Applied Mathematics, University of Sheffield, UK. (b) WWF Indonesia, Jakarta and Riau, Indonesia. Background The clearance of the world's primary tropical forests continues virtually unabated, driven by a continually expanding need for timber production, agriculture and the development of infrastructure. The consequences of deforestation are a very significant annual loss of biomass to atmospheric carbon dioxide and the destruction of irretrievable biodiversity. Yet there is huge uncertainty in the estimates of global deforestation rates[1]. Reducing this uncertainty is crucial to assessments of global carbon balance for climate modeling and harnessing political will for change. The economic motivation is strong and there is unlikely to be any change in behavior unless incentives are given to governments, landowners and communities. Current efforts to do this through the Reduced Emissions from Deforestation and Degradation (REDD) mechanism[2] are also dependent on reliable, independent estimations of deforestation rates, undistorted by the vested interests of governments and other parties. This, and limiting the building of plantations to land already cleared, would significantly improve the world’s anthropogenic carbon emission balance. Mapping the forest and deforestation activity is crucial to implementing this initiative. Project aims In this case study for Riau and Jambi we are developing routines for the detection of deforestation using ALOS PALSAR data. In collaboration with WWF and the Japan Space Agency JAXA we hope that the methods will be extended to the whole of Indonesia and provide the Indonesian and global community with a tool to track natural forest cover change as a basis for action on biodiversity conservation and forest carbon management. In this poster we concentrate on results obtained using Fine Beam Dual (FBD) images. For comparison, some multi-temporal detections obtained from ScanSAR images at 46-day intervals are also briefly discussed. WWF land-cover databases The WWF have produced a detailed land-cover map for Riau and the neighbouring Jambi regions, derived from early 2007 Landsat data[3], which we have used as a training set for this study. A limited June-September 2008 database is now available that delineates forest and non-forest regions – by comparison areas deforested in the interim can be deduced. In this figure the region covered by the WWF 2007 database is shown as white outlines. Natural forest regions according to the WWF 2008 database are shown green and non-forest areas are shown in red. FBD images shown here fully overlap the latter database. Timeline The land cover databases for the scene discussed in this poster are based on the Landsat 60 images indicated here. Multi-temporal ScanSAR detections of deforestation have been made for the period spanning the lower bar. The acquisition times for the Fine-Beam Dual (FBD) images are shown in red. A The three images shown above are based on FBD composites as indicated in the legend. Forest canopy and other vegetation tends to depolarise backscatter and hence shows as green. The image on the left was acquired about 6 weeks after the Landsat 6 image that forms the basis for the database delineation overlaid in the centre image. There is a clear discrepancy between the database estimates and an intuitive assessment of the image. Cloud cover is severe in many tropical Landsat images and may contribute to database uncertainty. The image on the right shows a later FBD image where some of the deforested areas stand out in blue compared with the first image. For other deforested regions there is a clear change but it is more difficult to quantify. The anvil-shaped region just above dead-centre is a good example. Optical Imagery Landsat 5 Images of the same area rendered to RGB using channels 5,4 and 3 are shown left. The lower image Is contemporary with the later FBD image above. The rectangular, newly deforested region shows clearly and, as in the FBD image, the anvil-shaped feature is less-well defined Landsat 5 2006/09/03 Landsat 5 2008/06/20 This image shows the earlier FBD image (2007/06/28) masked by the database-estimated 2007-8 deforestation between. Multi-temporal ScanSAR detections are shown hatched in red. There are no detections in the blue (depolarising) regions leading us to suspect the database designation of forest in this region. Notably the anvil-shaped region (see figure 2) just above dead-centre is partially detected. A simple difference between the HV channels of the FBD images shown above highlights some of the deforested areas detected by ScanSAR very clearly, but misses others – notably the anvil-shaped region. Also, the result of this procedure is very speckled causing problems for automatic recognition by this method. The earlier Landsat image above was the best available from the time and emphasises the difficulty of using optical Imagery to develop accurate databases. What is visible tends to confirm our suspicions, based on FBD Analysis, that the database overestimates the primary forest region. Summary Reliable forest delineations are needed are needed to support and complement detections of deforestation by time-based methods. The FBD images shown here suggest that they can supplement databases derived from cloud-obscured optical imagery. Time-separated images clearly also contain deforestation information directly and we are examining texture–based measures to augment this and effect automatic detection. Notably, the regions picked out by FBD are both similar and different to those accessed Multi-temporal methods using ScanSAR suggesting that data fusion techniques may be usefully employed. References [1] Achard, F., H. D. Eva, et al. (2002). "Determination of Deforestation Rates of the World’s Humid Tropical Forests." Science297: 999-1002 [2] Parker, C., et al. The Little REDD+ Book. An updated guide to governmental and non-governmental proposals for reducing emissions from Deforestation and degradation. 2009; Available from: www.globalcanopy.org. [3] Uryu, Y., Mott C. et al. Deforestation, Forest Degradation, Biodiversity Loss and CO2 Emissions in Riau, Sumatra, Indonesia. WWF Indonesia Technical Report, December 2007. Email: m.whittle@sheffield.ac.uk; s.quegan@sheffield.ac.uk; kkkyulianto@yahoo.com; yumuryu@yahoo.com