Download
1 / 58
580 likes | 597 Views
Explore the 10-year market forecast, industry analysis, and survey results of the Remote Sensing Industry, focusing on stakeholder needs and technological advancements. Learn about key trends, challenges, and opportunities in the sector.

E N D
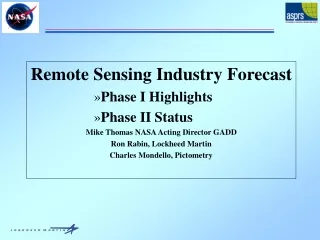
Remote Sensing Industry Forecast Phase I Highlights Phase II Status Mike Thomas NASA Acting Director GADD Ron Rabin, Lockheed Martin Charles Mondello, Pictometry
Presentation Overview • Space Act Agreement • Highlights of the Forecast Phase 1 activity and results • Gross revenue survey results • Forecast Phase 2 plans and activity to date
Background • In August 1999, ASPRS and NASA's Commercial Remote Sensing Program (CRSP) entered into a 5-year Space Act Agreement (SAA), combining resources and expertise to: • Baseline the Remote Sensing Industry (RSI) based on GEIA Model • Develop a 10-Year RSI market forecast and attendant processes • Provide improved information for decision makers • Government • Academic • Commercial • Stake Holders
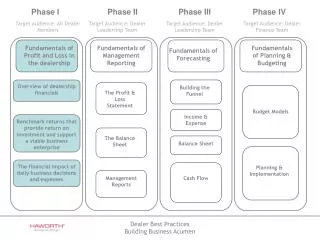
Phase I Characterize and Baseline Forecast of the U.S. RSI (Dec 2000) Phase IICharacterize and Identify End-user RS/GIS Needs and Requirements (Jan 2002) Phase III Validate I and II (Dec 2003) Technology Assessment Phase IV Market Forecast (Dec 2004) The Plan
Remote Sensing Industry Platforms & Sensors Data Collection Phase 1 Data Processing Support Elements Industry Intermediaries • Hardware • Software • Etc. • VARs • Consultants • Etc. Business Segments End-User Phase 2
Forecast Framework Customer Segments Business Segments Commercial Support Elements Government Intermediaries Market Segments Data Processing Academia Data Collection Utilities Mapping Forestry Civil Gov’t Exploration/ Resources Insurance Telecomms Real Estate Agriculture National/ Global Security Entertainment/ Media Transportation Environmental
17% 20% Forecast $ Interview Survey $ 21% 21% ANALYSIS Time 21% Findings Literature Search Conclusions Forecast Process
Overview of Phase I Results ASPRS/NASA Remote Sensing Industry Analysis and Forecast2000-2010 • Commercial • Academia • Government
ASPRS SAA LMSO Participants Aug 1999 - Feb 2001 Mike Thomas Acting Director Geospace Applications Development Directorate
Phase I Characterize and Baseline Forecast of the U.S. RSI (Dec 2000) Commercial Interviews
Companies operate in multiple business segments Commercial Sector Interviews
Relevant Interview Findings • Technology: Innovations needed to... • Speed availability of information • Provide information valued by user • Develop system of systems that integrate/merge applications, and provide multi-disciplinary solutions • Lower costs • Lack of Customer/Potential Customer Knowledge may be inhibiting • Market Growth • Applications based Marketing and Demonstrations may help • Workforce education • Requirements for entry-level persons exceed supply • How many students do we train and retain? (foreign students train in US, return • home)
Relevant Interview Findings • Competition • The international playing field is not level. • U.S. Companies are not "part of the Government" as are foreign competitors • Foreign competitor's workforces train in U.S. • Smaller companies have trouble "staying in the game” due to investment costs • Issue: US Government role? Industry role? • Governmental influence is pervasive... • Legislation and policies restricting U.S. company foreign sales; but do not hinder foreign companies • Government is predominant purchaser of data • Mergers with foreign companies are problematic • Standardization • Issues: Who should lead? Is anybody now? Is anybody now? Could/Should USG and Industry become closer “Partners” & “Speak with one voice?
Phase I Characterize and Baseline Forecast of the U.S. RSI (Dec 2000) Commercial Survey
Survey Sample Size 12% of ASPRS’ membership responded To fall 2000 online survey
Commercial Respondent Profile Respondents are predominantly middle/upper management level with a representative mix of technical and non-technical * Respondents could answer more than once.
Estimated RSI Sales (1998-2001, 2005, and 2010) Estimated RSI Sales based on respondent inputs
Estimated Geospatial Sales III 1998 to 2010 Forecast Baseline Based on calculating the average annual growth rate from 1998-2000 (respondent estimates) and applying that rate to the out-years AAGR
120 99 95 100 80 Number of Responses 60 60 44 40 20 0 Data Data Collection Industry Support Processing Intermediary* Elements Primary Role Companies operate in multiple business segments Support Elements Data 15% Processsing 33% Industry Intermediary* 20% Data Collection 32% Organization’s Primary Role (Business Segment) Commercial respondents often operate in multiple business segments (227 respondents; 298 responses; 5 respondents selected none ) * Industry Intermediaries include VARs. Companies are most involved in Data Collection & Data Processing
140 125 120 100 89 80 73 Number of Responses 60 40 20 0 Image Based GIS Photogrammetry Remote Sensing * Respondents may choose more than one. Geospatial Activities Image Based GIS Remote Sensing 25% 31% Photogrammetry 44% Geospatial Activities as Primary Business* Again, companies tend to operate in more than one business activity. Currently, Photogrammetry is the largest Primary Business in the RSI
Percent of Sales By Geospatial Activity • Is this due to marketing practices? Demand? Customer Awareness? • Is there opportunity in the lowest % of sales market segments?
Aerial Space Primary Platform Use CY 2000
Geospatial Activity in CY 2000 Sales In 2000, the Geospatial Activity that represented the primary business of RS Companies is Photogrammetry R&D However, Remote Sensing was receiving most R&D emphasis. Does this portend of future Trend?
Company Size Profile similar to MAPPS “Wages” Study • Smaller Companies are in the Majority in the U.S. RSI • About 20% are estimated at 10 or less employees • About 55% are estimated at under 100 employees • Over 80% are estimated at under 500 employees
Employees in the Core Companies of the RSI • Based on analysis of respondent estimates • And given that, based on ASPRS Data, there are about 220 “Core Companies” in the U.S. RSI, then …….. There Are About 200K Employees in the U.S. RSI
Estimated Number Employed in Geospatial Activities 70% 22% 8% • These are Assumed to be the Core of “Trained GIS Professionals” • 40% of the Companies Average 5 “Trained GIS Professionals” • 30% of the Companies Average 20
Employees in the Core Companies of the RSI Based On Analysis of Respondent Estimates … • There Are About 200K Employees in the U.S. RSI of Which • About 17.5K (8.75%), On Average, Are “Trained GIS • Professionals” Directly Involved in Geospatial Activities • We Suspect That the Density of “Trained GIS Professionals” • Decreases as Company Size Increases
Disconnect? Will Certification Help Solve? Most Difficult Job Skills to Hire
Estimated Annual Government R&D Investments 2000-2004 • Train/Educate USG Employees: $35M • Research New Types RS Data: $150M • New Types Satellite-based RS Data: $145M • New Types Aircraft-based RS Data: $180M • Purchase RS Data for Operational Applications: $185M • RS Technology: $775M • Total $1470M $ CY 2000 Constant CY 2000 Allocation of R&D by Geospatial Activities Is R&D driving a transition from Photogrammetry to RS?
Summary and Conclusions • The Remote Sensing Industry will Grow at about 13% Per Year, Reaching about $6B in Sales by 2010. • Companies in the RSI are multi-faceted. • more than one Market Segment; • more than one Business Segment; • more than one Geo-Spatial Activity • Currently, Across All Sectors, the most Active Markets/Apps/Activities/ Market Segments are: • Mapping/Geography • Environment • Civil Government • National/Global Security • Transportation • Less Attended Market Segments may be an Opportunity area (i.e., Utilities, Real Estate, Insurance, Telecommunications, Agriculture, Forestry, Entertainment/media) • Government data distribution policies contribute to a Perception that they may be adversely effecting commercial interests
Summary and Conclusions • Photogrammetry is Currently the Largest area of geo-spatial activity. However, R&D Investments indicate that a Shift to Remote Sensing may be in process • Most RSI Companies are small and do not invest in R&D • Commercial Survey and Interview Results are mutually reinforcing • There are about 200K employees in the “Core Companies” of the Commercial Sector of the RSI of which 8.75% (about (17K) are Directly Involved in Geo-Spatial Activities. • Ratio is probably higher in smaller companies than in larger ones • College/University Outputs may Not be Meeting Hiring Requirements of Industry. • At Colleges/Universities offering RS curricula, only About 1% of the Student population is enrolled in RS programs. Support for these programs, therefore, is small • Industry competes with Government for personnel resources • Government and/or private sector support are probably needed
Government Respondent Profile • Data are probably biased toward Federal level • State and Local interests are reflected • Relevance to Regional, Tribal or Other levels questionable About • 36% of respondents are scientists/researchers • 24% Executive Director/Senior Manager • 23% Program Staff • 17% Technicians
Government User Estimate of Photogrammetry and Remote Sensing Activities Change 2000-2004 More than 80% estimate that photogrammetry and remote sensing activities will grow over the next five years; over 30% estimate substantial to dramatic growth
Most Important Mission Mapping is the most Important Government Mission followed by Earth & Natural Science Research; Natural Resource Management; and Transportation • Health Services, Insurance, Legislative/Legal Enforcement, • Mining, and Telecommunications dropped out. Number of Responses *Check 1 of previous 3
Most Important Mission Activities Federal level has across the board interest, States appear to be focused more on Natural Resource Management and Utilities.
Overall External Factors Most Likely to Affect Mission Activities 2000-2004* Funding/Budget Changes is the Most Affective External Factor and Technology Evolution is a Key Factor * Pick up to 3
By Government Section, External Factors Most Likely to Affect Mission Activities 2000-2004* Top Affective External Factors: State and Local Levels: Funding/Budget; Technology; and Customer States also concerned with: Commercialization/Privatization; Politics; and New Legislation *Pick up to 3
Federal Agency Policies Re: Data Access and Distribution of Its Own Remote Sensing Data Holdings Do these policies adversely effect commercial interests, Or do they contribute to a Perception that they do ?
Summary and Conclusions • Most Active RS Markets/Apps/Activities (Generically grouped), (NOT rank ordered)
Government Survey Conclusions • Government activities in photogrammetry and remote sensing will increase through 2004. This will probably have positive growth effect on RSI Market • Budget, Technology, and Customer Needs appear to be factors most likely to affect mission activities; Political Considerations follow • A large % of respondents “Don’t Know” how much will be invested in various RS-related areas out to 2004; probably related to the strong relevance of budget affecting mission activities • However, investment in RS-related areas will probably continue at present levels out to 2004 • Government hiring in remote sensing and photogrammetry will remain at current levels 2000-2004 • The assertion that government competes with the private sector in the distribution of RS data gains credence based on agency policies • Government management structure will probably remain as is through 2004
Ten Year Remote Sensing Industry (RSI)ForecastGross Revenue Survey cm
Survey Background • Conducted November - December 2000 • CEO/CFO Level Responses • 25% Return Rate • Results Correlate Well with Phase I Interviews/Web Survey
Summary $120,000 $1,000,000 $3,900 $400 Gross Revenue, $K $1,000 $1 Low Median High Average is Approximately $10,000
Growth % Growth over Base Year 59% 60 47% 50 38% 40 29% Growth Rate, % 30 18% 20 10 0 2001 2002 2003 2004 2005 Calendar Year
Projected Revenues Revenues, $M $3,500 $3,000 $2,500 $2,000 $1,500 $1,000 $500 $0 2000 2001 2002 2003 2004 2005 Calendar Year
31% Satellite Other Aerial 28% 41% Market Elements % Gross Revenues
Business Segments Data Acquisition 20% Value Added Resale Data Processing 16% 24% 40% HW/SW % Gross Revenues
Market Segments National/Global Security 41% Mapping 17% Civil Government 15% Transportation 9% 4% Environmental Utilities 4% Agriculture 2% Exploration/Resources 2% Forestry 2% Telecommunications 2% Entertainment/Media <1% <1% Insurance Real Estate <1% Other <1% % Total Revenues
Remote Sensing IndustryPhase II Plan Overview Goal Characterize and Identify End-User RS/GIS Needs and Requirements rr