Download
1 / 29
290 likes | 382 Views
Explore the fourth assessment of Europe's 'Environment for Europe' process from Kiev to Belgrade, highlighting environmental challenges and their impact on society. This comprehensive assessment covers key areas such as climate change, biodiversity, marine environments, and sustainable consumption. Learn about changes, challenges, and sectoral drivers affecting the environment and health. Discover insights on air quality, water resources, climate change impacts, biodiversity loss, and sustainable consumption patterns across 53 European countries and over 870 million people.

E N D
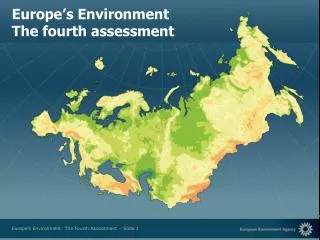
From Kiev to Belgrade • The ‘Environment for Europe’ process: environmental challenges and their relationship to society • 53 European countries, USA, Canada and Israel
From Kiev to Belgrade • The European Environment Agency prepared assessments for ministerial conferences in • Sofia 1995, • Århus 1998, • Kiev 2003, • In Belgrade 2007 the fourth assessment was presented.
The fourth assessment presents … • the current state of the pan-European environment • assessed in relation to social and economic change • for use as a basis for policy development and implementation • changes since Kiev
Main messages on: • Environment, health and the quality of life • Climate change • Biodiversity • Marine and coastal environments • Sustainable consumption and production • Sectoral drivers of environmental change
Environment, health and quality of life • AIR • Pollutant emissions in WCE falling but still significant. • Emissions in EECCA up by10% or more
Environment, health and quality of life Loss of statistical life expectancy (months) due to anthropogenic PM2.5 emitted in 2000 • AIR • Particulate material and ozone caused 380,000 premature deaths in Europe in 2000 • Small particles remain main health threat in EECCA and SEE
Environment, health and quality of life • WATER QUALITY • More than 100 million people in the region lack access to safe drinking water or adequate sanitation • In EECCA and SEE the quality of water supply and sanitation services has deteriorated continuously over the past 15 years. • The rural population is affected more than urban citizens. • Some improvement of water quality in rivers • But some large rivers remain severely polluted • MONITORING • Limited water quality data for EECCA and SEE - status and trends unclear
Environment, health and quality of life • WATER QUANTITY • One‑third of the pan‑European population lives in countries where water resources are under substantial pressure. • Over the past five years, the region has suffered more than 100 major floods. River catchments affected by flooding 1998-2005
Climate change • Energy consumption and GHG emissions increasing • Proposed EU target: 50% emission reduction globally by 2050 Source: IEA, 2006
Climate change • Environmental impacts: more extreme weather, rising sea level, shrinking ice cover • Economic impacts: agriculture and tourism • Adaptation measures needed even if emissions reduced
Biodiversity • More than 700 species in Europe threatened • Habitat loss from urban development, road construction, agricultural intensification, land abandonment • Invasive alien species • Climate change will increase pressures on biodiversity in coastal, arctic and alpine areas
Biodiversity loss • Networks of protected areas being created, but their conservation status is insufficiently known • Importance of sensitive agricultural and forestry areas with high nature value • Target of halting biodiversity loss in 2010 will not be met.
Marine and coastal environments • First general review of seas and coasts since 1995 (Dobris) • Pressure from over-exploitation of resources and high coastal population densities • Impacts aggravated by climate change • Policy actions are reducing concentrations of toxic chemicals in western seas.
Marine and coastal environments • Eutrophication in enclosed seas and sheltered waters • Overfishing and illegal fishing – needs improved policies and stricter law enforcement • Oil spills reducing, but significant oil pollution from sea transport and refineries
Sustainable consumption and production • Policy development: • On the policy agenda since 2003 (WSSD conference) • Slow progress since Kiev • Political process not converted into measurable results
Sustainable consumption and production Major regional differences in the efficiency of resource use
Sustainable consumption and production • Some decoupling achieved: • major differences in efficiency of resource use persist • link between economic growth and energy consumption broken in many countries • some decoupling not ‘real’–shift of burden to other countries
Sustainable consumption and production Trade flows between EECCA and WCE/SEE
Sustainable consumption and production • Growing consumption causing global environmental impacts • Greatest life-cycle environmental impacts from food and drink, private transport, housing • Tourism and air transport future key impact areas
Sustainable consumption and production • Waste generation is growing: • Driven by increase in economic activity and consumption • Municipal waste increasing by 2% annually, more in EECCA
Sectoral drivers of environmental change • Energy: energy consumption and GHG emissions increasing despite energy efficiency improvements and more renewables • Agriculture: irrigated area increasing, showing continuing intensification and causing decline in water resources and quality
Sectoral drivers of environmental change • Transport: • *Transport energy consumption and the resulting CO2 emissions per capita in WCE continue to be two to four times higher than in SEE and EECCA • *Growing in WCE and SEE, falling in EECCA Transport energy consumption per capita by region 1993 and 2004
Sectoral drivers of environmental change Tourism inbound and outbound expenditure—EECCA and SEE • Tourism increasing demand for the most environmentally damaging transport modes: cars and air
Options for future action • Promote implementation of regional environmental agreements (e.g. Black Sea, Caspian, Carpathian) • Set clear, realistic environmental targets and monitoring mechanisms • Strengthen governmental support for educationon sustainable development
Options for future action • Strengthen governmental support for public participation and awareness • Expand existing pan-European partnerships; • Continue regular assessments through a shared environmental information system • Further develop environmental indicators
European Environment Agency Kongens Nytorv 6DK-1050 Copenhagen KDenmark (+45) 33 36 71 00 eea.europa.eu