Download
1 / 14
140 likes | 254 Views
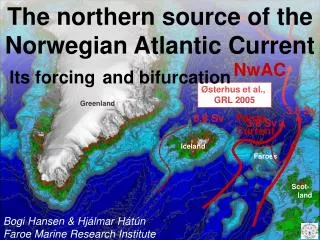
CT2 Meeting 5-6 March 2013 Hamburg How to monitor Atlantic inflow through the FSC Bogi Hansen. How to monitor Atlantic inflow through the FSC ?. Deploy ADCPs on section S ?. Or on section Z ?.

E N D
CT2 Meeting 5-6 March 2013 Hamburg How to monitor Atlantic inflow through the FSC Bogi Hansen
How to monitor Atlantic inflow through the FSC ? Deploy ADCPs on section S ? Or on section Z ? Or ???????????????????????????????????????? Deployed ADCPs on section S since 1994 Typically 3 – 4 ADCP across the channel S Z
Period 2009 – 2011Up to 7 ADCPs on section S Net flow = High inflow – High outflow Highly variable flow structure
Results from monitoring at section S By combining ADCP, CTD and altimetry data from the 1995 – 2009 period, we can estimate the average net inflow of Atlantic water through the FSC. The temporal transport variation is more accurate from calibrated altimetry than from ADCPs at section S. Would it be better to put the ADCPs on section Z ?
From altimetry, there is less recirculation through Z 100% 21% 79%
Deployments on section Z From May 2011 to May 2012: Deployed 6 ADCPs on section Z and 5 ADCPs on section S But, NO OVERLAP S Z
Atlantic layer(0 – 200 m)velocities ZA-ZB: R = +0.91 ZB-ZC: R = - 0.80 ZC-ZE: R = +0.85
Correlation ADCP-Altimetry 0.83 0.77 0.42 0.90 0.60
ADCP-basedvolume transport Correlation between ADCP-transport and MSLA difference across the section: R = 0.53
Comparing MSLA at Z and S Correlation after averaging 1 week: R = 0.64 1 week: R = 0.73 4 weeks: R = 0.78 12 weeks: R = 0.82 a0 z0 a6 z6
So, what to do this summer ? Should we deploy ADCPs on section S or Z ? Or, can we just rely on altimetry to get transport ? Do we need moored hydrography sensors ? Or, just use gliders ? I don’t know I don’t know I don’t know I don’t know
The research leading to these results has received funding from the European Union 7th Framework Programme (FP7 2007-2013), under grant agreement n.308299 NACLIM www.naclim.eu