Download
1 / 17
170 likes | 278 Views
This presentation details a novel approach to blue sky detection in images, addressing limitations in prior methods that primarily relied on color classification. By implementing a polynomial modeling technique, the authors propose a more accurate detection framework. The method involves generating an initial belief map, selecting seed and candidate sky regions, and applying polynomial fitting to achieve a more reliable sky detection. The study demonstrates improved precision in identifying sky regions, which is vital for various applications in image understanding, enhancement, and retrieval.

E N D
Improved Blue Sky Detection Using Polynomial Model Fit Andrew C. Gallagher, Jiebo Luo, Wei Hao Presented By: Majid Rabbani Eastman Kodak Company 1 Andrew C. Gallagher,Jiebo Luo, Wei Hao
Motivation • Problem statement • About 1/2 of consumer photos are taken outdoor • About 1/3 of the photos contain significant pieces of sky • Detection of key subject matters in photographic images to facilitate a wide variety of image understanding, enhancement, and manipulation • Applications • Scene balance • Image orientation • Image categorization (indoor/outdoor) • Image retrieval • Image enhancement 2 Andrew C. Gallagher,Jiebo Luo, Wei Hao
Prior Art on Sky Detection • Many methods focus on color • Color classification, Saber et al., 1996 • Color + location (orientation) + size, Smith et al., 1998 • Color + texture + location (orientation), Vailaya et al., 2001 • Drawback with the prior art • Unable to reject other similarly colored/textured/located objects • Some need to know image orientation • Moving beyond color • A physical model is desirable to characterize the physical appearance of blue sky (Luo et al, ICPR 2002) • Low false positive rate, but small sky regions are missed because they are too small to exhibit proper gradient signal • An extension to the model is needed to reduce the false negatives (missing small regions) 3 Andrew C. Gallagher,Jiebo Luo, Wei Hao
Overview of the Sky Detection Method • An initial sky belief map is generated using Luo et al., 2002. • A seed region is selected from the non-zero belief regions • Candidate sky regions are selected • Polynomial modeling is used to determine which candidate sky regions are consistent with the seed sky region • A final belief map of complete sky is produced INPUT IMAGE INITIAL BLUE SKY DETECTION INITIAL BELIEF MAP SEED REGION SELECTION CANDIDATE SKY REGION SELECTION POLYNOMIAL MODELING FINAL BELIEF MAP CLASSIFICATION 4 Andrew C. Gallagher,Jiebo Luo, Wei Hao
Initial Blue Sky Detection • Physical model-based methodby Luo et al., 2002 is used • Stage 1: Color ClassificationA trained neural network assigns a probability value to each pixel. An image-dependentthreshold is determined. • Stage 2: Signature VerificationA final probability for eachregion is determined based onthe fit between the region and the physics-based model. Original Initial Belief Map Clear Sky Signature Wall Signature Code Value Position Position 5 Andrew C. Gallagher,Jiebo Luo, Wei Hao
Seed Region Selection • Each non-zero belief region in the belief map is examinedand a score is computed • The region having the highestscore is the seed region • Having a single seed region prevents conflicts that maylead to false positives. Original Seed Region Initial Belief Map 6 Andrew C. Gallagher,Jiebo Luo, Wei Hao
Candidate Sky Region Selection • Sky colored regions from the initial blue sky detector(including regions initially rejected) are examined to find candidate sky regions • Candidate sky regions must befree of texture • The seed region cannot bea candidate sky region Original 1 2 3 Candidate Sky Regions 4 6 5 7 7 Andrew C. Gallagher,Jiebo Luo, Wei Hao
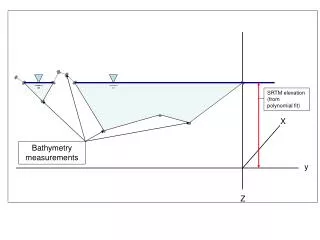
Polynomial Modeling- Stage 1 • A two-dimensional model is fit(via least squares) to each color channel of the seed region • Model errors are computed for each color channel Original • Model error for example seed region is:2.2 1.4 0.9 in red,grn,blu , and are pixel valueestimates. , and are the polynomialcoefficients. Visualization of the polynomial for the entire image 8 Andrew C. Gallagher,Jiebo Luo, Wei Hao
Polynomial Modeling- Stage 2 • A second polynomial is fit to both the seed region and acandidate sky region • Model errors for stage 2 are computed for each color channel over just the candidate sky region • Assuming both the seed regionand the candidate sky regionare sky, the model errors should be low (on the sameorder as the errors from stage 1) Original 1 2 3 Candidate Sky Regions 4 6 5 7 9 Andrew C. Gallagher,Jiebo Luo, Wei Hao
Classification • A candidate sky region is classified as sky when: • The stage 2 errors are less thanT0 (preferably 4.0) times the stage 1 errors • The stage 2 errors do not exceed a threshold T1(preferably 10.0) • The assigned belief value isequal to the seed region belief value • Regions can be “promoted” in their belief value Original 1 2 3 Candidate Sky Regions 4 6 5 7 10 Andrew C. Gallagher,Jiebo Luo, Wei Hao
Classification Results Initial Belief Map 1 2 3 Candidate Sky Regions Final Belief Map 4 6 5 7 11 Andrew C. Gallagher,Jiebo Luo, Wei Hao
Experimental Results • The algorithm was applied to 83 images with at least one sky region classification from the initial sky detector • Initial sky detector performance • 88 correct detections • 16 false positives • Precision: 85% • Polynomial model fitting results • 31 additional correct detections • 8 additional false positives • 6 correct promotions of a region’s belief value • Precision: 82% 12 Andrew C. Gallagher,Jiebo Luo, Wei Hao
Experimental Results (TP) Original Initial Sky Belief Map Final Sky Belief Map 13 Andrew C. Gallagher,Jiebo Luo, Wei Hao
Experimental Results (FP) • Most (6 out of 8) false positives were reflections of sky • These regions were small and nearly uniform, else they would have been rejected for exhibiting an opposite gradient to the seed region Original Initial Sky Belief Map Final Sky Belief Map 14 Andrew C. Gallagher,Jiebo Luo, Wei Hao
Image Enhancement • The sky belief map canbe used to alter the sky saturation to achieve more pleasing color • This requires a complete, accurate belief map Original With Initial Belief Map With Final Belief Map 15 Andrew C. Gallagher,Jiebo Luo, Wei Hao
Image Enhancement • The polynomial can also be used to hypothesize the image without objects that occlude the sky • The sky belief map is analyzed to find sky occluding objects, which are “filled in” using the polynomial Final Sky Belief Map Original Map of Occluding Objects Final Image 16 Andrew C. Gallagher,Jiebo Luo, Wei Hao
Conclusions • Detection of blue sky is a fundamental content understanding problem relevant to a large number of consumer image related applications • The polynomial model fitting takes advantage of the spatial smoothness of sky, building a model from known sky regions to augment additional regions into a complete sky belief map 17 Andrew C. Gallagher,Jiebo Luo, Wei Hao