Download
1 / 22
220 likes | 345 Views
The reshaping of urban structure in South Africa through municipal capital investment : Evidence from 3 municipalities. Sharthi Laldaparsad, EM Policy Research Statistics South Africa. Well known structural and morphological deficiencies of SA cities.

E N D
The reshaping of urban structure in South Africa through municipal capital investment: Evidence from 3 municipalities Sharthi Laldaparsad, EM Policy Research Statistics South Africa
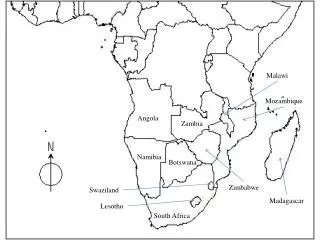
Well known structural and morphological deficiencies of SA cities Source: Stats SA & CSIR, 2013; NUDF, 2009 • Importance • Continues to be the primary sites of population growth • Drivers of economic growth • Concentration of poverty, social and ecological challenges
The RDP in 1994 introduced spatial planning concepts such as “the need to break down the apartheid geography through land reform, more compact cities and decent public transport” (1994:83) and “densification and unification of the urban fabric” (1994:86). • “Since 1994, densities have increased in some urban areas and there has also been partial regeneration of inner cities, but, overall, little progress has been made in reversing apartheid geography, and in some cases the divides have been exacerbated” (NDP 2011: 238).
For nearly 20 years, the concept of “restructuring South African cities” remained at the top of the urban spatial planning agenda. • Since 1994 several policies and legislative mechanisms were implemented to transform the spatial landscape of SA. • SDFs are regarded as the key spatial restructuring tool for local municipalities. • Perhaps the most under-recognised instrument for spatial restructuring is the municipal budget itself. • The need has arose for a comprehensive spatial vision for the country. • A strategic approach to capital investment is essential to enable spatial transformation. • Infrastructure planning more powerful in shaping the spatial structure of cities than spatial planning (Todes, 2008). • Aligning & integrating the two, effective restructuring mechanism for local municipalities. To what extent is there alignment in the City of Jo’Burg, City of Cape Town, & the Rustenburg Local Municipality.
The presentation looks at - • the capital investment patterns in 3 municipalities of South Africa over the five-year period, 2007/8 to 2011/12. • whether municipal capital spending patterns have contributed to reshaping the spatial structure of the municipalities. • whether municipal capital investment follows the strategic vision of the IDPs and the SDFs. • the statistical and geographical frameworks underpinning such planning.
Capital spending for the five-year period Capital spending has largely benefitted key historical economic hubs. Other areas have benefited but to a lesser extent. Capital spending between 15-21% of municipal budget. Over 80% spent on basic services infrastructure. Given budget constraints more motivation to align policies.
The City of Jo’Burg Economic spending: south, south east parts of the city (CBD, City Deep, Devland); parts of Soweto. Social spending: parts of Soweto; City Centre, Cosmos City Housing spending: southern parts, east-west corridor; also in Cosmos City. Infrastructure spending: City Centre, Cosmos City, Diepsloot area.
The City of Jo’Burg Highest spending in the consolidation area (public transport, soccer infrastructure, inner city regeneration), although SDF strategy mentions it should limit spending there. Spending for new housing development outside the densification priority area and movement system of the city. Mixed-use and industrial nodes have attracted higher levels of capital spending. Central city areas have attracted high levels of capital spending, whilst other public transport management areas have not.
The City of Cape Town Economic spending: CBD, south-east parts of the City; urban regeneration areas like Mfuleni, Maccassar, Khayelitsha. Social spending: CBD, south-east parts of the City like Langa, Blue Downs, Khayelitsha. Housing spending: southern & south-east suburbs (Belhar, Khayelitsha, Bellmont Park), far north-western parts (Atlantis), Kuilsrivier & Brackenfell areas. Infrastructure spending: In and around the CBD (Green Point, Milnerton areas).
The City of Cape Town • Accessibility grid in and around the CBD have attracted high capital spending. • IRT (phase 1) has influenced spending patterns. Areas in the far north, not part of the accessibility grid, linked thro IRT. • Parts of the marginalised area in the SE of the city have received capital spending, but much lower than the designated metropolitan nodes.
The Rustenburg LM Economic spending: north-western areas, north of the central city, later years eastern parts. Social spending: higher density low income areas like Meriting, Freedom Park, Phokeng. Housing spending: new housing development close to central city, then also to rural settlements. Infrastructure spending: in and around the central city; also low income residential areas like Meriting.
Rustenburg Local Municipality • Areas where residential, industrial and commercial development nodes are defined, have attracted higher levels of capital investment. • With the exception of the central areas, both the rapid bus transport system and the development corridor did not attract substantial capital spending.
Concluding statements on the integration: Some concepts of the SDF strategies did indeed influenced capital spending patterns, however there is still significant scope to improve on the integration and alignment. All case-study municipalities identified measures to manage urban growth (urban edge, compaction, densification, development corridors, viable nodes). And to address connectivity (BRT, IRT, Rapid Bus Transport system). Public transport corridors (focus areas for development & intensification) has high levels of influence over investment in the City of Cape Town, but less pronounced in the City of Jo’Burg& Rustenburg LM. Areas identified as development nodes (residential, industrial, commercial) generally attracted higher levels of capital spending. There is evidence of capital spending directed towards marginalised areas, although the central core is the main focus. Mainly due to urban renewal & the main centre of the transport system. There are evidence of integrated spending for housing projects & its infrastructure. Although many housing projects are located outside the main development & accessibility areas, municipalities are using expensive transport infrastructure investment to connect fragmented settlements.
Government’s unique capacity to secure consensus between public & private capital investment, enabling the achievement of multiple development aims such as economic development, employment creation and service delivery (UN-Habitat, 2008).
Using the census data – planning of capital projects (where to invest), monitoring & evaluation of spending outcomes (impact on quality of life)
Using the census data – planning of capital projects (where to invest), monitoring & evaluation of spending outcomes (impact on quality of life)
Using the census data – planning of capital projects (where to invest), monitoring & evaluation of spending outcomes (impact on quality of life)
Using the census data – planning of capital projects (where to invest), monitoring & evaluation of spending outcomes (impact on quality of life)
CAPEX 2011 CAPEX 2012 Stats SA collects CAPEX data from National, Provincial, District, Municipal public entities; and public corporations. Important source for empirical evidence on the implications of infrastructure spending: does it contribute to growth in SA? Does it reduce poverty? Data must be spatial referenced – location of spending. SDFs must give direction to capital expenditure.
Municipal integrated geo-statistical system Provincial integrated geo-statistical system National National integrated geo-statistical system Municipal and provincial Dissemination geographies with key statistical data Regions Wards Settlements Small areas Cadastre and addresses Framework geographies with identifiers and classifiers Other core spatial datasets Policy design and implementation National priorities more jobs, united state, more infrastructure, better education and health, adequate housing – better quality of life Aligning policy will imply standard geographical boundaries. Current data supply not suitable for planning. Call for innovative approaches to provide the required statistical data for planning. Aligning policy will imply mechanisms (like a small spatial unit with regular key statistical denominators) that can aggregate to other geographical levels Strong case for the spatial management of municipal financial data. Having a national statistical system that underpins development planning: a spatial expression of facts & figures Implying integrated geo-statistical information systems, from National to below the municipal level.
Thank You email: sharthil@statssa.gov.za Acknowledgements - Danie, Herman, Amanda & Prof Geyer from CRUISE.