Download
1 / 17
170 likes | 344 Views
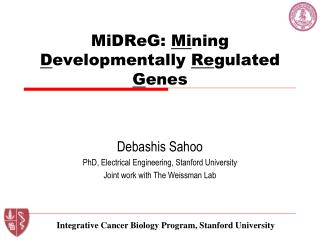
MiDReG: Mi ning D evelopmentally Re gulated G enes. Debashis Sahoo PhD, Electrical Engineering, Stanford University Joint work with The Weissman Lab. Integrative Cancer Biology Program, Stanford University. Perspective. Database of Dynamic ranges of each probesets. RMA.

E N D
MiDReG: Mining Developmentally Regulated Genes Debashis Sahoo PhD, Electrical Engineering, Stanford University Joint work with The Weissman Lab Integrative Cancer Biology Program, Stanford University ICBP, Stanford University
Perspective Database of Dynamic ranges of each probesets RMA 4878 Human Microarrays 2167 Mouse Microarrays Poster #38 Jun Seita BooleanNet MiDReG Predicts developmentally regulated genes Database of Boolean implications Debashis’ Poster MiDReG Identifies a branchpoint between B and T cell development Poster #17 Matt Inlay Biology of HSC differentiation ICBP, Stanford University
Motivation • Hard to discover using other approaches • Genetics • Biochemistry • These genes carry out important functions • Development and differentiation • Surface markers are easy to study ICBP, Stanford University
BooleanNet Get data GEO [Edgar et al. 02] Normalize RMA [Irizarry et al. 03] Determine thresholds Discover Boolean relationships Biological interpretation Sahoo et al. Genome Biology 2008 ICBP, Stanford University
Intermediate Threshold Determine threshold • A threshold is determined for each gene. • The arrays are sorted by gene expression • StepMiner is used to determine the threshold High CDH expression Low Sorted arrays [Sahoo et al. 07] ICBP, Stanford University
Discovering Boolean Implications • Analyze pairs of genes. • Analyze the four different quadrants. • Identify sparse quadrants. • Record the Boolean relationships. • ACPP high GABRB1 low • GABRB1 high ACPP low 2 4 GABRB1 1 3 ACPP Sahoo et al. Genome Biology 2008 ICBP, Stanford University
Six Boolean Implications Sahoo et al. Genome Biology 2008 ICBP, Stanford University
Prediction of Developmentally Regulated Genes A A X B X B ICBP, Stanford University
Computational Discovery of Human B Cell Precursors ICBP, Stanford University
qPCR Results Test: Median1 < Median2 10/14 pass (FDR 14%) × × × × ICBP, Stanford University
More B Cell Precursors ICBP, Stanford University
Validation ICBP, Stanford University
Analysis of Predicted Genes • Total number of genes predicted: 62 • 33 genes have been knocked out in mice. [Literature] • 18 genes have defects in B cell function and B cell differentiation. • 2 genes are known prognostic markers of B cell lymphomas: WASPIP and GCET2. ICBP, Stanford University
Conclusion • MiDReG uses Boolean implications to predict genes related to B cell development • Knockouts of the predicted genes have defects in B cell function and differentiation • MiDReG can be directly applied to other less well-characterized developmental pathway ICBP, Stanford University
Acknowledgements David L. Dill Sylvia K. Plevritis Irving L. Weissman The Weissman Lab: Deepta, Jun, Matt Robert Tibshirani Funding: ICBP Program (NIH grant: 5U56CA112973-02) ICBP, Stanford University
The END ICBP, Stanford University
B A a00 ( ) a01 a11 a00 1 error rate = + 2 (a00+ a01) (a00+ a10) a00 a10 Statistical Tests • Compute the expected number of points under the independence model • Compute maximum likelihood estimate of the error rate nAlow = (a00+ a01), nBlow = (a00+ a10) total = a00+ a01+ a10+ a11, observed = a00 expected = (nAlow/ total * nBlow/ total) * total ICBP, Stanford University