Download
1 / 22
240 likes | 354 Views
Visualization of protein 3D structure in reduced representation with intramolecular interactions. Vrunda Sheth & Dr Reyes. Overview of the talk. What is PDB Atom file of a PDB Protein 3D structure Types of interactions What is a reduced structure

E N D
Visualization of protein 3D structure in reduced representation with intramolecular interactions. Vrunda Sheth & Dr Reyes.
Overview of the talk • What is PDB • Atom file of a PDB • Protein 3D structure • Types of interactions • What is a reduced structure • Flow chart for obtaining the reduced structure • Visualization of the reduced structure
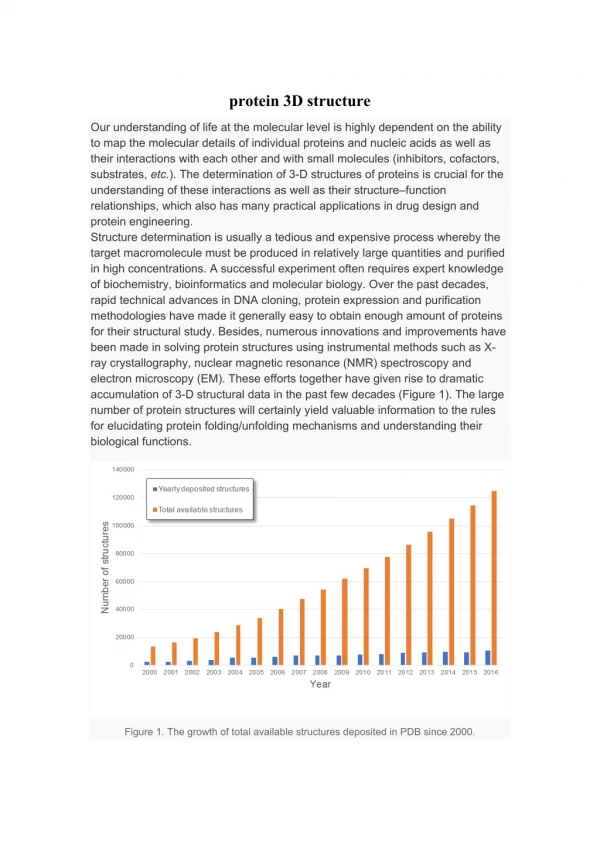
What is PDB? • PDB stands for Protein Data Bank. • It’s a central repository for all protein 3D structure. • Contains about 60,000 proteins. • New structures are added every Wednesday. • http://www.rcsb.org/pdb/home/home.do
Growth of PDB From PDB annual report July 2008
Atom file • Atom file is a coordinate file containing all the information of the protein 3D structure • Has a large header that summarizes the protein, citation information, method of structure determination etc. • It has 3D location of every atom of the protein.
Atom file The various columns are residue number, residue name, amino acid, chain, amino acid number, x,y,z coordinates, occupancy, temperature factor, element symbol.
Existing protein models. • There exists different ways to represent a protein 3D structure. • AAR : all atom representation. Too much information and difficult to see secondary structure and bonds. • Ribbon structure: Secondary structure can be identified but no chemical information about the intramolecular interactions. • Represented in following slides is protein 1rfy which is all-alpha transcriptional repressor protein.
AAR model • Each and every atom is represented • CPK model • Carbon is grey. • Hydrogen is white. • Oxygen is red. • Nitrogen is blue. • Sulfur is yellow.
Ribbon model • The secondary structure consists of 2 α-helical chains. • Shows how the secondary structures are connected to each other. • Does not show the intramolecular Hbonds and VDW forces.
Types of Interractions • 2 important interactions which shape the 3D structure of a protein are • Hydrogen bond • Vander-waals interaction. • Generally the H bonds are 10X times stronger than VDW interactions. • However there are 10x times more VDW forces than H bonds. • Hence the 2 contribute equally to the 3D structure.
Hydrogen bond • Hydrogen bond is formed when 2 electronegative atoms like nitrogen and oxygen share a common hydrogen atom. • The Hbond distance is usually about 2.8 angstroms. Ref: http://en.wikipedia.org/wiki/Hydrogen_bond
Vander waals force. • It’s a weak transient electrical attraction between two hydrophobic amino acids or one polar and one hydrophobic amino acid. • The distance (Vander waals radii ) is generally conserved. • These conserved distance and the identity of atoms involved in VDW interactions help identify VDW interaction sites in protein.
Protein representation. http://en.wikipedia.org/wiki/Protein_structure
Lot of information. Difficult to see H-bonds and VDW interactions. Enough chemical information. Can see the structure as well as intramolecular interactions Too little information. Can only see the secondary structure. No interactions seen. • AAR DCRR Ribbon Why reduced structure?
Reduced Structure • Instead of representing all the atoms in a protein • Each amino acid of a protein in represented as 2 data points • Center of mass of the backbone. • Center of mass of the side chain. • The hydrogen bonds and the Vander Waals interactions are kept intact.
Flow Chart to get and display the reduced structure of protein.
Steps in MatLab • Separate the backbone and the side chain residue. • Plot the backbone • Plot lines extending from backbone to centroid of sidechain. • Plot the Hbonds and VDW forces. • Color code the proteins according to their polarity. • Label all the amino acids with single letter code. • Rotate the protein.
After visualization • Create a wrapper script to combine all the tasks prior to visualization into a single script. • Create a web interface for users to enter the PDB id of a structure and get the reduced representation. • Create a script that will periodically get all the new structures from PDB and convert them to a reduced representation.
References • H.M. Berman, J. Westbrook, Z. Feng, G. Gilliland, T.N. Bhat, H. Weissig, I.N. Shindyalov, P.E. Bourne The Protein Data Bank. Nucleic Acids Research, 28 pp. 235-242 (2000) • http://www.rcsb.org/pdb/home/home.do • http://www.rpc.msoe.edu/cbm/resources/pdf/section1.pdf • http://en.wikipedia.org/wiki/Protein_structure