Download
1 / 49
490 likes | 729 Views
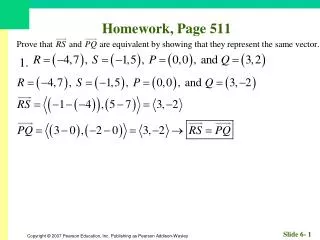
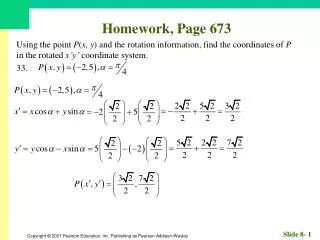
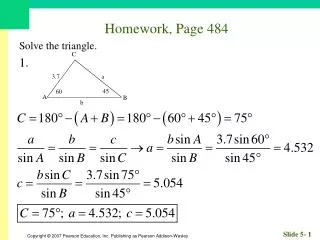
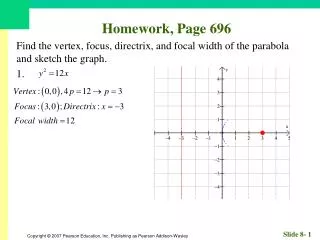
Homework, Page 530. Match the parametric equations with their graph. Identify the viewing window that seems to have been used. 1. b. The window appears to be. Homework, Page 530. (a) Complete the table for the parametric equations and (b) plot the corresponding points 5.

E N D
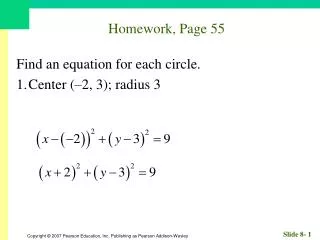
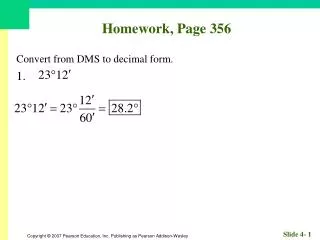
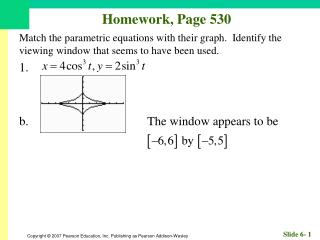
Homework, Page 530 Match the parametric equations with their graph. Identify the viewing window that seems to have been used. 1. b. The window appears to be
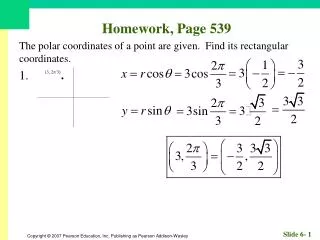
Homework, Page 530 (a) Complete the table for the parametric equations and (b) plot the corresponding points 5.
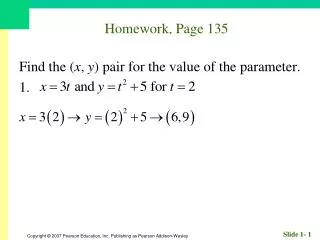
Homework, Page 530 Graph the parametric equations x = 3 – t2, y = 2t in the specified parameter interval. Use the standard viewing window. 9.
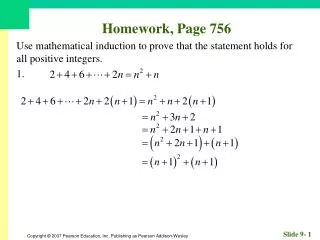
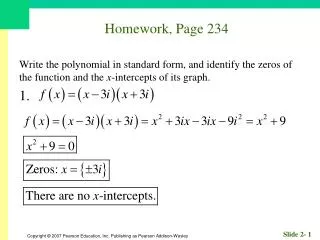
Homework, Page 530 Eliminate the parameter and identify the graph of the parametric curve. 13.
Homework, Page 530 Eliminate the parameter and identify the graph of the parametric curve. 17.
Homework, Page 530 Eliminate the parameter and identify the graph of the parametric curve. 21.
Homework, Page 530 Eliminate the parameter and identify the graph of the parametric curve. 25.
Homework, Page 530 Find a parameterization for the curve. 29. The line segment with endpoints (3, 4) and (6, –3).
Homework, Page 530 Refer to the graph of the parametric equations given below. Find the values of the parameter t that produce the graph in the indicated quadrant. 33. Quadrant I
Homework, Page 530 37. Ben can sprint at the rate of 24 fps and Jerry sprints at the rate of 20 fps. Ben gives Jerry a 10-ft head start. The race can be modeled by the parametric equations: a. Find a viewing window to simulate a 100-yard dash. Graph simultaneously with t starting at t = 0 and t-steps of 0.05. b. Who is ahead after three seconds and by how much. Ben is ahead by 2 ft.
Homework, Page 530 41. The graph of the parametric equations x = 2 sin t and y = 2 cos t is a circle of radius 2 centered at the origin. Find an interval of values for t so that the graph is the given portion of the circle. a. The portion in the first quadrant. b. The portion above the x-axis. c. The portion to the left of the y-axis.
Homework, Page 530 45. Kirby hits a ball 4ft above the ground with an initial velocity of 120 fps at 30° above the horizontal toward a 30-ft high fence 350 ft away. Suppose that the moment Kirby hits the ball, there is a 5 fps wind gust blowing in the direction Kirby hit the ball. a. Does the ball clear the fence?
Homework, Page 530 45. Kirby hits a ball 4ft above the ground with an initial velocity of 120 fps at 30° above the horizontal toward a 30-ft high fence 350 ft away. Suppose that the moment Kirby hits the ball, there is a 5 fps wind gust blowing in the direction Kirby hit the ball. b. If so, by how much does it clear? If not, could the ball be caught? The ball clears the fence by about 1.5 ft.
Homework, Page 530 49. Orlando hits a ball 4ft above the ground with an initial velocity of 160 fps at 20° above the horizontal toward a 30-ft high fence 440 ft away. How strong in fps must a wind gust be toward or away from the fence to cause the ball to hit within a few inches of the top?
Homework, Page 530 53. The graph of the parametric equations x = t – sin t and y = 1 – cos t is a cycloid. a. What is the maximum value of y = 1 – cos t? How is that value related to the graph b. What is the distance between neighboring x-intercepts?
Homework, Page 530 A particle moves along a horizontal line so that its position at any time t is given by s (t). Write a description of the motion. 57.
Homework, Page 530 61. Which of the following points corresponds to t = –1 in the parameterization a. b. c. d. e.
Homework, Page 530 65. Consider the parametric equations , and on . a. Graph the parametric equations for a = 1, 2, 3, 4 in the same window. b. Eliminate the parameters in the parametric equations to verify that they are circles. What is the radius?
Homework, Page 530 65. Now consider the parametric equations and c. Graph the equations for a = 1 using the following pairs of values for h and k.
Homework, Page 530 65. d. Eliminate theparameter t in the parametric equations and identify the graphs. e. Write a parameterization for the circle with center (–1 , 4) and radius 3.
6.4 Polar Coordinates
5. 4. 10 11 40º 35º 8 6 Quick Review Use the Law of Cosines to find the measure of the third side of the given triangle.
5. 4. 10 11 40º 35º 8 6 7 6.4 Quick Review Solutions Use the Law of Cosines to find the measure of the third side of the given triangle.
What you’ll learn about • Polar Coordinate System • Coordinate Conversion • Equation Conversion • Finding Distance Using Polar Coordinates … and why Use of polar coordinates sometimes simplifies complicated rectangular equations and they are useful in calculus.
Example Find the distance between two aircraft if one is located at (5, 65º) and the second is at (9, 135º).
Homework • Homework Assignment #6 • Read Section 6.5 • Page 539, Exercises: 1 – 65 (EOO), 51
6.5 Graphs of Polar Equations
What you’ll learn about • Polar Curves and Parametric Curves • Symmetry • Analyzing Polar Curves • Rose Curves • Limaçon Curves • Other Polar Curves … and why Graphs that have circular or cylindrical symmetry often have simple polar equations, which is very useful in calculus.
Polar Curves and Parametric Curves Polar curves are, in reality, a special type of parametric curves, where , for all values of θ in some parameter interval that suffices to produce a complete graph (in many cases, 0 ≤ θ≤ 2π).
Symmetry The three types of symmetry figures to be considered are: • The x-axis (polar axis) as a line of symmetry. • The y-axis (the line θ = π/2) as a line of symmetry. • The origin (the pole) as a point of symmetry.
Symmetry Tests for Polar Graphs The graph of a polar equation has the indicated symmetry if either replacement produces an equivalent polar equation. To Test for SymmetryReplaceBy • about the x-axis (r,θ) (r,-θ) or (-r, π-θ) • about the y-axis (r,θ) (-r,-θ) or (r, π-θ) • about the origin (r,θ) (-r,θ) or (r, π+θ)
Example Analyzing a Polar Graph Analyze the polar graph of Domain: Range: Continuity: Symmetry: Boundedness: Maximum r-value: Asymptotes: