Download

1 / 26
270 likes | 655 Views
Homework, Page 756. Use mathematical induction to prove that the statement holds for all positive integers. 1. . Homework, Page 756. State an explicit rule for the n th term of the recursively defined sequence. Use mathematical induction to prove the rule. 5. . Homework, Page 756.

E N D
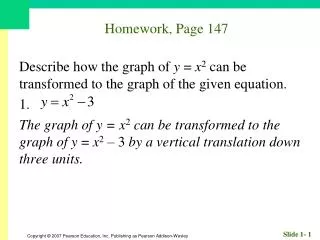
Homework, Page 756 Use mathematical induction to prove that the statement holds for all positive integers. 1.
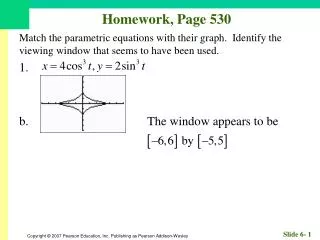
Homework, Page 756 State an explicit rule for the nth term of the recursively defined sequence. Use mathematical induction to prove the rule. 5.
Homework, Page 756 Write the statement P1, Pk, and Pk+1. 9.
Homework, Page 756 Use mathematical induction to prove the statement for all positive integers. 13.
Homework, Page 756 Use mathematical induction to prove the statement for all positive integers. 17.
Homework, Page 756 Use mathematical induction to prove the statement for all positive integers. 21. The sum of the first n terms of a geometric sequence with first term a1 and common ration r≠ 1 is
Homework, Page 756 Use the results of 21 – 24 and Example 2 to find the sums. 25.
Homework, Page 756 Use the results of 21 - 24 and Example 2 to find the sums. 29.
Homework, Page 756 Use the results of 21 - 24 and Example 2 to find the sum in terms of n. 33.
Homework, Page 756 37. The goal of mathematical induction is to prove that a statement Pn is true for all real numbers n. Justify your answer.
Homework, Page 756 • Mathematical induction • The formula for the sum of a finite arithmetic sequence. • The formula for the sum of a finite geometric sequence. A. I only. B. I and II only. C. I and III only. D. II and III only. E. I, II, and III only.
9.7 Statistics and Data (Graphical)
What you’ll learn about • Statistics • Displaying Categorical Data • Stemplots • Frequency Tables • Histograms • Time Plots … and why Graphical displays of data are increasingly prevalent in professional and popular media. We all need to understand them.
Terminology • Sets of data tabulate one or more characteristics, called variables, of each member of a population, called objects or individuals. • Categorical variable - identifies an individual as a member of a distinct class, such as male or female, or freshman, sophomore, junior, or senior • Quantitative variables have numerical values, such as height or weight
Leading Causes of Death in the United States in 2001 Cause of Death Number of Deaths Percentage Heart Disease 700,142 29.0 Cancer 553,768 22.9 Stroke 163,538 6.8 Other 1,018,977 41.3 The causes of death noted above are categorical variables. Source: National Center for Health Statistics, as reported in The World Almanac and Book of Facts 2005.
Bar Chart, Pie Chart, Circle Graph bar graph 3-D pie chart circle chart In the bar graph, the x-axis is labeled by category. Since the categories are unconnected, the bars are not adjacent to one another. The pie and circle charts demonstrate how the data in the individual categories add up to the total
Stemplots • Stemplots - a presentation of numerical data where the data is split into a stem consisting of the initial digit or digits, and a leaf, which is the final digit
Example Making a Stemplot Make a stemplot for the given data. 12.3 23.4 12.0 24.5 23.7 18.7 22.4 19.5 24.5 24.6
Frequency Table • A table showing the frequency with which data in a specified range appear in the total data set is called Frequency Table. An example would be a list of heights of students with the number of students who are at each height listed in adjacent columns.
Histogram • A histogram is a bar chart that shows the data of a frequency table in graphic form
Time Plots • Time plots show us how some particular variable changes over time. • The plot is developed by plotting the variable on the y-axis and time on the x-axis. • Individual data points are connected by straight lines to complete the time plot
Example, Page 768 2. Make a back-to-back stemplot comparing the annual home run production of Roger Maris to that of Hank Aaron.
Example, Page 768 10. Draw a histogram of the frequency table in exercise 8.
Example, Page 768 14. Make a time plot for Mickey Mantle’s annual home run totals.
Homework • Homework Assignment #32 • Review Section 9.7 • Page 768, Exercises: 1 - 29 (EOO), 31