17 D measuring spread of data
250 likes | 410 Views
17 D measuring spread of data. To be able to describe a set of data we need to Measure both its 1) center and 2) its spread . Three distributions B and A has the same mean but different spreads. 4 different measures of spread. 1) range 2)interquartile range IQR 3) variance

17 D measuring spread of data
E N D
Presentation Transcript
To be able to describe a set of data we need to Measure both its 1) center and 2) its spread
Three distributions B and A has the same mean but different spreads
4 different measures of spread • 1) range • 2)interquartile range IQR • 3) variance • 4) standard deviation
The range • Difference between the maximum and minmum data value
The interquartile range interquartile range= upper quartile – lower quartile
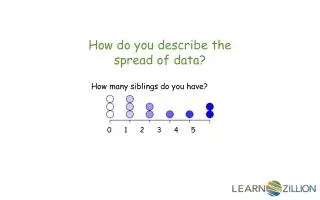
Median and the qurtiles • The median divides the data set into two halves • The quartiles you get if you divide the halfs again and take the mean of the halfs..
Example • Find the interquartile range for the data set • 6,4,7,5,3,4,2,6,5,7,5,3,8,9,3,6,5 • First find the median and then lower and upper quartile
Example • Find the interquartile range for the data set • 6,4,7,5,3,4,2,6,5,7,5,3,8,9,3,6,5 • First find the median and then lower and upper quartile • Median = 5 (nine th value)
2 3 3 3 4 4 5 5 lower quartile is the mean of this sequence • Q1 = (3+4)/2 = 3.5
Upper half • 5 6 6 6 7 7 8 9 • Q3 = (6+7)/2 = 6.5
Now • The quartile range = upper quartile – lower quartile • IQR = Q3 – Q1 • IQ3 = 6.5 -3.5 = 3
Percentile • Is the score below which a certain percentage of the data lies.
The lower quartile Q1 • Is the 25 th percentile • Since 25 % of the data points are below this value
If you score in a test is the 85% percentile then 85% of the class has scored less than you.
Statistical term ogive • Also called ogee
The word ogive//ogee originally come from a term in architecture for a diagonal rib of a Gothic vault or a pointed arch • the Late Latin obvita, the feminine past participle of obvire, to resist or go against (and thus supporting).
Percentiles • Lower quartiel is 25 th percentile • 25 % of the data are below this data point
Percentiles • Lower quartile is 25 th percentile • 25 % of the data are below this data point • Median is the 50 th percentile • And upper quartile Q3 is the 75 th percentile