Download
1 / 5
50 likes | 193 Views
Quantify and explain the major ocean GHG sources and sinks and their interannual variability in the North Atlantic”. Radiatively Active Gases from the N. Atlantic Region and Climate Change ( RAGNARoCC ) Andy Watson, UEA.

E N D
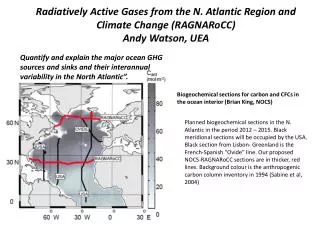
Quantify and explain the major ocean GHG sources and sinksand their interannualvariability in the North Atlantic”. Radiatively Active Gases from the N. Atlantic Region and Climate Change (RAGNARoCC)Andy Watson, UEA Biogeochemical sections for carbon and CFCs in the ocean interior (Brian King, NOCS) Planned biogeochemical sections in the N. Atlantic in the period 2012 – 2015. Black meridional sections will be occupied by the USA. Black section from Lisbon- Greenland is the French-Spanish “Ovide” line. Our proposed NOCS-RAGNARoCCsections are in thicker, red lines. Background colour is the anthropogenic carbon column inventory in 1994 (Sabine et al, 2004)
Observing the Subpolar North Atlantic Programme The OSNAP line, comprising: (A) German 53°N western boundary array and Canadian shelfbreak array; (B) US West Greenland boundary array; (C) US/UK East Greenland boundary array; (D) Netherlands western Mid-Atlantic Ridge array; (E) US eastern Mid-Atlantic Ridge array; (F) UK glider survey (yellow) over the Hatton-Rockall Bank and Rockall Trough; (G) UK Rockall Trough and Scottish Slope Current array. Red dots: US float launch sites. Blue star: US OOI Irminger Sea global node. Black concentric circles: US sound sources.
Observing the Subpolar North Atlantic Programme (OSNAP) The OSNAP array. Background: climatological mean salinity (colours, psu); black solid (dashed) lines: isopycnals at 0.05 (0.10) kg m-3 intervals; vertical lines: proposed mooring locations; glider domain: shaded box. Black moorings: direct velocity measurements; gray moorings: both direct velocity measures and endpoints for the geostrophic regions. Eastern boundary array. Colour contours: 15-year mean meridional velocity (cm s-1, +ve northward) from the FLAME 1/12° model used for the OSSE; thin black contours: potential density (kg m-3); zonally-integrated (eastwards, from zero in the west) meridional transport: thick black line The UK DWBC moored array, flanked by the WHOI EGC array and the OOI moorings. Key: instrument types; background (colour scale): velocity (+ve northwards
DI223 1996 DI230 1997 DI233 1998 DI242 1997 DI253 2001 P314 2004 CD176 2005 D312 2006 D321 2007 D3402009 D351 2010 D365 2011 Scottish Association of Marine Science & National Oceanography CentreExtended Ellett Line Programme http://www.noc.soton.ac.uk/obe/PROJECTS/EEL/index.php
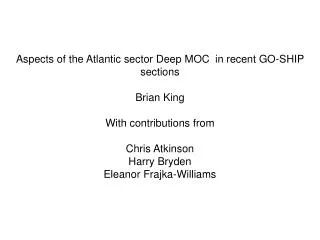
US AMOC / UK RAPIDInternational Science Conference Co-Chairs: Jim Carton, Stuart Cunningham Baltimore, USA : 16-19 July, 2013 • Dynamics and Timescales of MOC Variability • Observations (transatlantic arrays, overflows and boundary current arrays). • SST & AMOC variability. • AMOC in high-resolution models.