Current Version; CCM E39/C Future: ECHAM5/MECCA
280 likes | 472 Views
NO x Emissions [Tg N/a]. Surface, aircraft, lightning. Photolysis. Dynamics (ECHAM). T30, 39 layers, top layer centred at 10 hPa. Chemistry (CHEM). Prognostic variables (vorticity, divergence, temperature, specific humidity, log-surface pressure, cloud water),

Current Version; CCM E39/C Future: ECHAM5/MECCA
E N D
Presentation Transcript
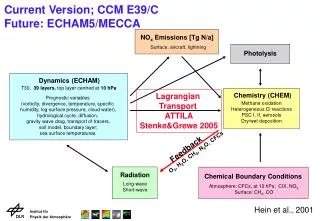
NOx Emissions [Tg N/a] Surface, aircraft, lightning Photolysis Dynamics (ECHAM) T30, 39 layers, top layer centred at 10 hPa Chemistry (CHEM) Prognostic variables (vorticity, divergence, temperature, specific humidity, log-surface pressure, cloud water), hydrological cycle, diffusion, gravity wave drag, transport of tracers, soil model, boundary layer; sea surface temperatures. Methane oxidation Heterogeneous Cl reactions PSC I, II, aerosols Dry/wet deposition Feedback O3, H2O, CH4, N2O, CFCs Chemical Boundary Conditions Radiation Atmosphere: CFCs, at 10 hPa: ClX, NOy, Surface: CH4, CO Long-wave Short-wave Current Version; CCM E39/C Future: ECHAM5/MECCA Lagrangian Transport ATTILA Stenke&Grewe 2005 Hein et al., 2001
High variability Ozone hole Evolution of ozone column [DU]: 1960 - 2000 1960 1980 2000 1980
Ozone influx: ozone origin Northern Hemisphere: Ozone mainly produced in NHMSTRMSTRTS NHMS: high inter-annual variability Southern Hemisphere: Ozone mainly produced in TRTSSHMSTRLS SHMS lowinter-annual variability solar cycle visible Grewe, 2005
The lightning NOx source Kurz and Grewe, 2002
Variability and trends in the tropical UT: ENSO MLS H2O, UT, Tropics E39/C H2O, 200 hPa,Tropics 150E 90W (ppmv) Longitude • Model reproduces individual strong events almost identical, e.g. 1995/96, 1997/98
Marked ozone tracers in a NMHC-model: MOZART-2 1890 1990 anthropogenic natural stratosphere Lamarque et al., 2005
Ozone changes in the tropical upper troposphere (30S-30N; 500-200 hPa) • Lightning: • most important source for ozone • Large contrib. to variability Stratospheric ozone second most important source From 1990 Industry and surface transportation
Stratospheric ozone follows influx from stratosphere, producing ±2% variability out of a totale interannual var. of ±4% Lightning ozone correlated with Nino Index variability: ±1-2% De-seasonalized ozone changes in the tropical UT
Evolution of ozone in NH lower troposphere (30N-90N; 500-1000 hPa) Most important sources: Industry, surface transportation, lightning, stratosphere
Evolution of de-seasonalized ozone in NH lower troposphere (30N-90N; 500-1000 hPa) ~25% ~30% -5% • Year-to-year variability strongly dominated by stratosphere (±5%) • Trend in ozone (25% increase): • - results from increase in NOx emissions (Industry and traffic) • Trend reduction in 80s caused by lower emissions and • lower stratospheric contribution.
Conclusion (1) • Stratosphere • realistical variability of dynamics • realistical ozone trend (10% by H2O trend Stenke&Grewe, 2005) • Interannual ozone-variability well reproduced (DWD-Ozonbulletin) • Validation mainly based on direct comparison with observation (TOMS, ...) • Stratosphere-Troposphere Exchange • ozone influx diagnosed, solar cycle influences variability • different ozone origins for STE on NH and SH results in different variability • Findings based on special diagnostics: ozone origin • Troposphere • inter-annual variability in ozone attributed to sources • NH ozone trend: Industry+Traffic (+30%), slower in 80s Reduction in 80s, caused by Strat-O3 • Findings based on special diagnostics: ozone emission relation (tagged tracers)
Conclusion (2) • The identification of climate-chemistry interactions, • e.g. 'How does climate change chemistry?' • largely depends on additional diagnostics. • 2 Diagnostics presented • a) Ozone origin diagnostic • b) Ozone - emissions source relation • How well do we understand these processes: • a) How much of the ozone in the troposphere is originally produced • e.g. in the tropics 30 km? • b) How much ozone is produced e.g. by lightning? • Model intercomparison would help to understand these processes. • Observational data maybe partly available.
Institut für Physik der Atmosphäre
Overview • Motivation • Modell / Experiment • Stratosphere: • Circulation: Validation • Chemistry: Ozone: What determines its variability • Impact on the troposphere • Troposphere • NOx and Lightning • Ozone Trends • Summary
40°N 40°N Änderungen des Wasserdampf-Mischungsverhältnis an der thermischen Tropopause
Randel et al., 2004 E39/C: Wasserdampftrend in 80 hPa, 40°N und 40°S
Boulder 40°N E39/C: Wasserdampftrend an der thermischen Tropopause1980-2000 (!)
Variabilität durch vorgeschriebene Antriebe • Einfluss von Vulkanen
Variabilität durch vorgeschriebene Antriebe • Einfluss der quasi-zweijährigen Oszillation (QBO)
Variabilität der Ozongesamtsäule in 30° - 60°N, JFM 12 DU ± 4 DU
Variabilität durch vorgeschriebene Antriebe • Einfluss der solaren Aktivität • (11-Jahres Zyklus)
Zusammenfassung • Ergebnisse der früheren Zeitscheibenexperimente (1960, 1980, 1990) und die daraus abgeleiteten Schlüsse (z.B. Hein et al., 2001; Grewe et al., 2001; Schnadt et al., 2002) werden bestätigt. Berechnete klimatologische Mittel dynamischer und chemischer Größen sowie saisonale und interannuale Variationen stimmen mit Beobachtungen weitestgehend überein. • Langzeitliche Veränderungen (Trends) werden in der transienten Simulation zufriedenstellend reproduziert. • Das Modell zeigt überraschenderweise Ähnlichkeiten mit beobachteten, singulären Ereignissen, besonders in der Südhemisphäre. • Vorgeschriebene Meeresoberflächentemperaturen, die Berücksichtigung der solaren Variabilität und der QBO spielen für die Variabilität der (Modell-)Atmosphäre eine wichtige Rolle, große Vulkanausbrüche beeinflussen die Atmosphäre nur für wenige Jahre.