Download
1 / 18
180 likes | 317 Views
This study investigates the application of wavelet transform in analyzing planetary nebulae (PN), focusing on their spatial frequency content and the detection of faint structures. By processing images from the Hubble Space Telescope (HST), we identify 14 extracted PN based on angular diameter, showcasing how wavelet transform provides insight into temperature fluctuations and substructures that were previously unnoticed. Our findings suggest that wavelet transform is a promising tool for enhancing the understanding of morphological complexities in nebulae.

E N D
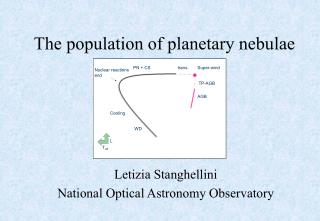
Planetary Nebulae and Wavelet Transform Francois Cuisinier GEMAC/OV – UFRJ (Brazil) Co-workers: A.P. Moises (ON/MCT, IAG/USP) M.L. Ferreira (GEMAC/OV – UFRJ) C.R. Rabaca (GEMAC/OV – UFRJ) D.R. Goncalves (IAG/USP)
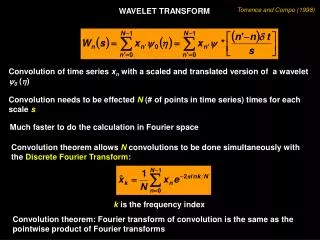
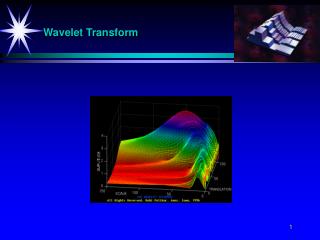
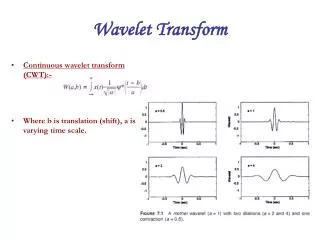
Wavelet Transform: What for? • Wavelet Transform is a mathematical transform that analyzes the spatial • frequencies content of images • Wavelet Transform is invariant to scaling • (e.g. particularly fit to put into evidence fractal structures) • The decomposition functions have finite support a no artificial high frequencies (like in Fourier Transform) a the frequency information is kept locally, and can easily be visualized • Noise can be removed according to the spatial scales
Our Sample • 14 PN selected from HST archive • Selected on the basis of their size: Angular diameter between 5 and 30 arcsec, in order (1) to have a sufficient size to present detectable substructures (2) to fit into the planetary camera of the WFPC2
Hb4 - Halo F656N (Ha) Mass Halo = 1/3 Mass total
Hen 2-402 F658N [NII] wavelet processed image raw image
NGC 6891 NOT images – Guerrero et al. 2000
NGC 6891 NOT images – Guerrero et al. 2000
Application of Wavelet Transform to Temperature Fluctuations • Temperature Fluctuations have historically been put into evidence by the comparison of temperatures derived by different methods, sensitive to different regions (e.g. [OIII] and Bac). • Some direct measurements (e.g. through the mapping of one temperature indicator ([OIII] or Bac) exist (HST imaging or ground based /HST spectroscopy), but generally indicate fairly low Temperature Fluctuations • Temperature fluctuations are however usually described by a unique weighted mean indicator, t2 • t2 does not yield any indication on the location of the Temperature Fluctations
How can Wavelets help ? • Can put into evidence faint structures, as TF from [OIII] maps ratios a Te = f ( TW (I4363) / TW (I5007) ) • The amplitude of the variations is however small, possibily • at the limit of the detection of Wavelet Transform • Need to find some objective argument to segregate artifacts • from true structures
NGC6210 Green:significative TF White: no significative TF
NGC6210 Observadas Observadas [OIII] 4363/5007 Å Simuladas Simuladas Null information: Simulation of intrinsic [OIII] 4363/5007 Å through (5007 + noise)/5007 Å Region without significative TF Region with significative TF
NGC6818 Green:significative TF White: no significative TF
Conclusions • Wavelets allow to put into evidence faint substructures, even in dense areas in planetary nebulae which have not been much explored • before. • Though our HST sample is far from complete, much more planetary • nebulae seem to present substructures than quoted in previous studies. • This needs however to be verified, since many of these substructures have scales of 1-2 pixels. • Wavelet Transform has a potential to assess temperature fluctuations from [OIII] images ratios.