Schematic Representation of Post-Transplant Sera in Kidney Allograft Recipients
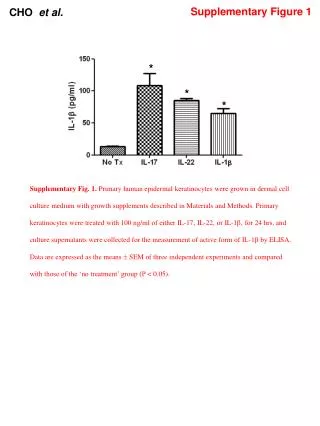
This figure illustrates the schematic representation of sera collected from 256 kidney allograft recipients across multiple time points post-transplantation. The analysis includes samples from 22 patients, tested in a donor-specific Elimination Cytotoxicity Mixed Lymphocyte Reaction (ECXM) to assess immune responses over periods M2, M4, Y1 to Y7. This data provides valuable insights into the immunological profile of kidney transplant recipients and helps in understanding the dynamics of transplant rejection and tolerance.

Schematic Representation of Post-Transplant Sera in Kidney Allograft Recipients
E N D
Presentation Transcript
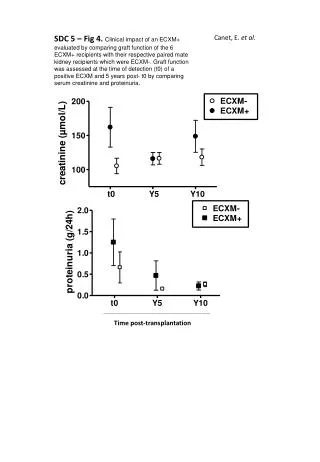
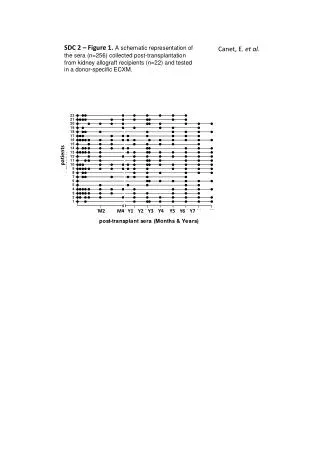
SDC 2 – Figure 1. A schematic representation of the sera (n=256) collected post-transplantation from kidney allograft recipients (n=22) and tested in a donor-specific ECXM. Canet, E. et al. patients M2 M4 Y1 Y2 Y3 Y4 Y5 Y6 Y7