Download
1 / 40
540 likes | 793 Views
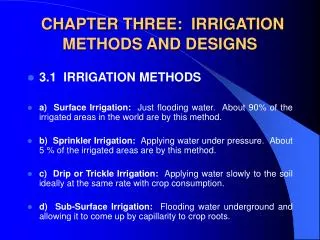
MANAGING DEFICIT IRRIGATION: FROM THE CROP TO THE DISTRICT Elias Fereres Institute for Sustainable Agriculture (IAS-CSIC) and University of Cordoba, Spain WASAMED, Jordan, 30 Sept.- 4 Oct. CORDOBA, SPAIN. WATER SCARCITY. PROBLEMS AND CHANGES. Rainfall in Sevilla. 1100.

E N D
MANAGING DEFICIT IRRIGATION: FROM THE CROP TO THE DISTRICT Elias Fereres Institute for Sustainable Agriculture (IAS-CSIC) and University of Cordoba, Spain WASAMED, Jordan, 30 Sept.- 4 Oct. CORDOBA, SPAIN
PROBLEMS AND CHANGES Rainfall in Sevilla 1100 Annual rainfall 1000 Average rainfall (1940-2003) 900 800 700 Rainfall (mm) 600 500 400 300 200 1940 1950 1960 1970 1980 1990 2000 Year WATER SCARCITY DROUGHT PROBLEM: unreliability of water supply TOWARDS A MORE SUSTAINABLE USE OF WATER FOR FOOD AND NATURE UNDER SCARCITY IN ANDALUCÍA, SOUTHERN SPAIN • During the drought periods there was an increase in horticulture (plastic greenhouse) along the costal line (5%) • The area of irrigated field crops decreased to 60% of the irrigable area
TOWARDS HIGH WATER PRODUCTIVITY WP RANGE FIELD CROPS...................0.2-0.4 €/m3 FIELD HORTICULTURE......1-2 €/m3 OFF-SEASON VEGETABLES UNDER PLASTIC................6-20 €/m3
IRRIGATION WP AND EMPLOYMENT Empleo generado (UTA/100 ha) Productividad del agua (Ptas./m3; ) WP (Fuente: Inventario de Regadíos de Andalucía, CAP - 1999)
Vulnerability of Irrigation Supply In Andalucía Reliability of Irrigation Supply in the Guadalquivir Valley (Public networks under surface water, 0.2 M ha , 1981-2002) Allocation Number of irrigation seasons Impact on the crops (% of design) 85 - 100 9 (41%) Low 65 - 85 6 (27%) Medium 35 - 65 2 (9%) High 0 - 35 5 (23%) Very high 22 (100%) TOTAL CAP Junta Andalucía/CHG (2003)
ON TERMINOLOGY, DEFICIT IRRIGATION= APPLICATION OF WATER BELOW THE NET IRRIGATION REQUIREMENTS (ET-R) SUPPLEMENTAL IRRIGATION= 1. IRRIGATION APPLICATIONS TO SUPLEMENT RAINFALL IN HUMID & SUB-HUMID AREAS (AIMING AT MAXIMUM ETc) 2. APPLICATION OF VERY SMALL IRRIGATION AMOUNTS IN ARID AREAS (FAR FROM MAXIMUM ETc)
CROP YIELD OR VALUE WATER PRODUCTIVITY= WATER USED UNDER WATER SCARCITY, EMPHASIS SHIFTS FROM + PRODUCTION TO + PRODUCTIVITY DEFICIT IRRIGATION NORMALLY INCREASES WATER PRODUCTIVITY
DI REDUCES IRRIGATION WATER USE, BUT... DOES IT REDUCE WATERCONSUMPTION? TWO SITUATIONS, 1. THE DEFICIT IN APPLIED WATER MAY BE BALANCED VIA STORED SOILWATER, THUS, DI DOES NOT INDUCE ET DEFICITS AND YIELDS SHOULD NOT BEAFFECTED. 2. STORED SOIL WATER DOES NOT FULLY COMPENSATE THE DEFICIT IN IRRIGATION WATER, ET DEFICITS OCCUR AND YIELDS MAY BE AFFECTED.
inCASE 1,IWU IS REDUCED BUT NOT ET,MAY NOT LEAD TO NET WATERSAVINGS inCASE 2,BOTH IWU AND ET ARE REDUCED, LEADS TO NET WATER SAVINGS (Reduced Consumptive Use) MAJOR RESEARCH ISSUE: ET OF STRESSED CANOPIES?
Water Use in Irrigation ET 60 100 Irrigation Water Supply Area 2 Irrigation Water Supply Area 1 Runoff Irrigation Return Flows 40 30 20 ?? Deep Percolation
FARMERS USE OF DEFICIT IRRIGATIONONE SITUATION:DI IS FORCED ON FARMERS BY INSUFFICIENT SUPPLY DUE TO:-DROUGHTS - INADEQUATE NETWORK DESIGN - RIGID DELIVERY SCHEDULES.......NORMALLY, WATER STRESS IS DIFFICULT TO MANAGE IN THIS SITUATION
IT CAN BE DONE! One Example: The GENIL-CABRA ID, ANDALUSIA,SPAIN CASE 1, WATER SUPPLY LIMITATIONS, MOST COMMON. COMPLEX PROBLEM OF OPTIMAL WATER ALLOCATION, MANY ISSUES: TECHNICAL, ECONOMIC, SOCIAL, INSTITUTIONAL, AND CULTURAL APPROPRIATE SCALES:FROM FARM TO IRRIGATION DISTRICT, UP TO THE BASIN
Genil-Cabra Irrigation District: • Over 7,000 ha, Pressurized Network • Chronic Water Scarcity • Individual Records of Water Use (15 years) • Bio-Physical Simulation Model • (Crops, Soils, Irrigation Systems, Network) • Economic Optimization Model
Agua consumida / Agua requerida Relative Irrigation Supply DEFICIT IRRIGATION IS COMMON Relative Irrigation Supply Sackler Colloquium, NAS 2004 (Lorite et al., Irrig.Sci., 2004)
1,2 1 R 1 2 3 4 5 2 IP 500 m3 ha-1 1,0 3 IWP 500 m3 ha-1 4 IP 1500 m3 ha-1 0,8 5 IWP 1500 m3 ha-1 Cumulative frequency 0,6 0,4 0,2 0,0 -10 -5 0 5 10 15 Total net income (M€) Simulated Net Income Distribution (48 years) for the GCID for Three Scenarios and Two Allocation Policies (Proportional, IP and + Water Productivity, IWP) (Lorite et al., submitted )
INSTITUTIONAL FACTORS OF DEFICIT IRRIGATION WATER AGENCIES IRRIGATION ASSOC. Reduce Uncertainty in Share the resource; Water Supply Participation in Decision-making Provide Flexibility Plan Ahead RISK MANAGEMENT
FARMERS USE OF DEFICIT IRRIGATION ANOTHER SITUATION: FARMERS CHOOSE TO APPLY DEFICIT IRRIGATION (Deliberate application of irrigation amounts less than required) WHY? WHEN ANTICIPATED PROFITS WOULD EXCEED THOSE UNDER FULL IRRIGATION (INCREASED RISK SHOULD BE INCLUDED IN THE ASSESSMENT) IN THIS CASE, STRESS MANAGEMENT IS THE KEY
MANAGED DEFICIT IRRIGATION Applied to: - BIOMASS PRODUCTION - FIELD CROPS - TREE CROPS AND VINES
DI FOR BIOMASSPRODUCTION:THE CASE OF ALFALFA Calculated for Cordoba, using WP values from Asseng and Hsiao (2000) Cumulative Biomass (kg ha-1) Cumulative alfalfa ET (mm)
DEFICIT REGION High ETo, VPD Water required (mm) to produce one ton of alfalfa at Cordoba Water Requirements (mm t-1)
DEFICIT IRRIGATION IN FIELD CROPS 12 APPLIED WATER ET Losses 9 Yield (t/ha) 6 3 IWP IM 0 0 250 500 750 1000 ET or Applied Irrigation Water (mm) YIELD RESPONSE TO ET AND TO APPLIED WATER
Water Productivity in relation to Wheat Yield in Bushland, TX. (Musick et al., 1994)
The situation in China: Wheat and Corn • Use of plastic to maximise T • Stress Management via Irrigation Applications at Phenological Stages Wheat: Y= 2-6 t/haWP= 1-2 kg/m3IWP= 1-4 kg/m3 (Fan et al., 2005) Wheat : Y= 4-7 t/ha WP= 1-1.5 kg/m3 Corn:Y= 7-10 t/ha WP= 1.5-2 kg/m3(Zhang et al., 2005) DI IN FIELD CROPS: THE CASE OF VERY LIMITED AMOUNTS OF WATER Arid Areas:Wheat Profits maximised at yields around 4-5 tha-1 (ICARDA) • CONCLUSION: • MAXIMUM WP ACHIEVED AT RELATIVELY HIGH YIELDS • EQUITY AND POLITICAL CONSIDERATIONS
1.25 1.00 0.75 HI / HI (Bmax) 0.50 0.25 0.00 0.2 0.4 0.6 0.8 1.0 0.0 B / Bmax RELATIVE HARVEST INDEX AS FUNCTION OF RELATIVE BIOMASS AS AFFECTED BY WATER DEFICITS Cotton, Sorghum (2) Patterns ofHarvest Index ResponsesunderSustained Deficit Irrigation (1) Maize, Wheat
1.25 1.00 0.75 HI / HI (Bmax) 0.50 DI Sustained (Season) 0.25 DI in Reproductive Stages DI in Vegetative Stages 0.00 0.2 0.4 0.6 0.8 1.0 0.0 B / Bmax THE IMPORTANCE OF STRESS PATTERNS Harvest Index Responses of Sunflower to Stress Patterns developed by different DI programmes (Soriano et al.,2002)
EFFECTS OF IRRIGATION UNIFORMITY ON THE RELATION BETWEEN YIELD AND IRRIGATION WATER BUT WHAT IS THE RESPONSE FUNCTION? Fereres et al., 1993, ICSC, Ames, Iowa.
Regulated Deficit Irrigation in Trees and Vines (RDI): Planned water deficits at specific developmental stages Goals: -Reduced water use - Maintain or increase profits
OLIVE YIELD RESPONSE to ET, Three DI treatments. Cordoba, 1996-2000. (Moriana et al., 2003, JASHS)
Marginal WP of a mature olive orchard under water deficits (Moriana et al., JASHS, 2003) MWP (€/m3) ET (mm)
800 RDI SDI Full ET 700 Full I ETo (P-M) 600 DI 500 400 Applied Water and ETo (mm) 300 200 Harvest 100 0 240 260 70 RDI SDI 65 Full I 60 55 Fruit Diameter (mm) 50 45 40 35 120 140 160 180 200 220 day of year A comparison between Sustained DI and Regulated DI in Peach. Cordoba, 2002-2005. 2003 Phase 3 F.G. DOY
Yield Fruit volume Relative FV (t ha-1) (cm3) Treatment Full SDI RDI 42.2 a 38.6 b 41.2 a 213 a 198 b 213 a 100 92.9 100 Averages for 2002-2005
Almond responses to Stress Patterns developed by Deficit Irrigation (Goldhamer et al., in press) SDI RDI
Mature Navel Oranges; San Joaquin Valley; 3 Season Mean (Courtesy Dr. D.Goldhamer, UCDavis)
Mature Navel Oranges; San Joaquin Valley; 3 Season Mean (Courtesy Dr. D.Goldhamer, UCDavis)
NEW FACTOR: CROP QUALITY
How is DI Applied? PRD, DI..Max.T Need more research IN DI, THE CRITICAL ISSUES ARE: 1.Irrig. Amounts 2.Stress Patterns RDI IN WINEGRAPES
WHERE IS IRRIGATED AGRICULTURE GOING? DEPENDS ON THE AVAILABILITY OF WATER & ON POLITICS
DEFICIT IRRIGATION WILL BE THE NORM RATHER THAN THE EXCEPTION