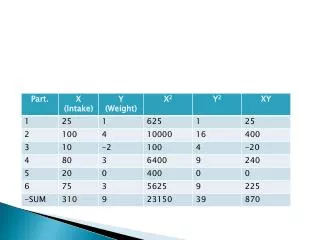
Advanced Biomolecular Visualization and Computation Techniques at CCV, UT Austin
190 likes | 329 Views
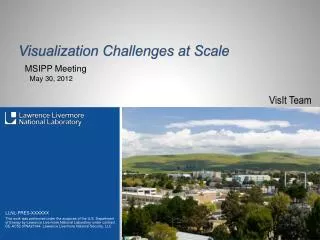
This document presents the cutting-edge techniques for biomolecular visualization and computations developed at the CCV Angstrom, University of Texas at Austin. Emphasizing flexible modeling, volumetric representation, and interactive rendering, it covers algorithms for rendering large biomolecules, protein docking, and cryo-EM data processing. Key innovations include adaptive models, hierarchical data structures for bond-level detail, and compression-based techniques for time-varying volume rendering. This research aims to enhance understanding of complex biomolecular systems through advanced computational methods and visualization strategies.

Advanced Biomolecular Visualization and Computation Techniques at CCV, UT Austin
E N D
Presentation Transcript
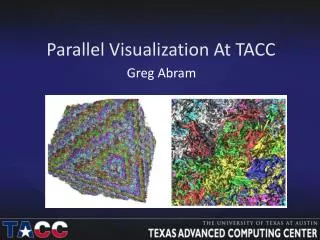
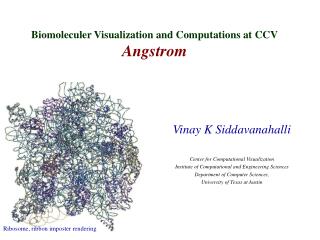
Biomoleculer Visualization and Computations at CCVAngstrom Vinay K Siddavanahalli Center for Computational Visualization Institute of Computational and Engineering Sciences Department of Computer Sciences, University of Texas at Austin CCV, ICES, University of Texas at Austin Ribosome, ribbon imposter rendering
Application domain • Visualization • Volume, Imposter and Isosurface models • Grid / client server rover based. • Compression based, and hardware accelerated algorithms • Animation • Flexible models • Volumetric video compression and interactive rendering • Bioinformatics • Quantitative • Qualitative • Topological • Protein docking • Compressed format, with flexibility information CCV, ICES, University of Texas at Austin
Electron density Volume + isocontours PDB files Electrostatic potential Volume + isocontours SES, SCS Linear, higher order meshes Imposter rendering Model creation – from the PDB database Volume rendering of hemoglobin Volume rendering of Rice dwarf virus CCV, ICES, University of Texas at Austin
Model creation – from imaging datasets Protein Cryo-EM Data Bank Images 2D Image Processing 3D Image Processing/Modeling ParticlePicking Gaussian Blurring Orientation Determination 3D Image Segmentation Particle Images Asymmetric Particle Estimated Classification Units Orientations Averages Reconstruction from 2D to 3D Medial Axis Extraction Feature Extraction Groups of Refinement Particles Alignment & Averaging 3DElectron Helices/Sheets Detection Shape Matching Density Map Reconstruction 2D/3D Image Enhancement and Correction with other information Secondary Pseudo-atomic AdaptiveFiltering Adaptive Contrast Enhancement CTF Correction Structures Structures CCV, ICES, University of Texas at Austin
Data structure • We use a combined hierarchical Volumetric, Surface and Bond-level structural representation. • Compressed data is used for time varying volume rendering and storage. We are also working on using it for other visualization algorithms including isosurface extraction. • There are two distinct pipelines we follow to produce our datasets • From the PDB. ( from which we receive bond level information ) • Imaging data sets of large biomolecules. CCV, ICES, University of Texas at Austin
Protein specific data structure • Since we use a hierarchical data structure for the bond-level domain, proteins can be represented naturally. • Bond information, like connectivity and torsion angles along the backbone are also maintained for flexibility modeling and visualization • Level of detail function computations and rendering is facilitated in this model. • It is extensible; level can be added, removed easily and each level uses arrays than lists to enable fast array rendering. • Each level is the same data structure, could just subclass to add more to it. Groups of proteins Protein a Protein p Chain 1 Chain c Secondary structure 1 Secondary structure s Residue 1 Residue r Atom list CCV, ICES, University of Texas at Austin
Multiresolution images Hemoglobin Residues Backbone chains Secondary structures CCV, ICES, University of Texas at Austin
Volumetric visualization • Volumes are generated either through Gaussian blurring ( to produce density maps ) or through APBS to obtain electrostatic potential maps. • Use texture based hardware rendering. • A hierarchical data structure on the bond level allows us to generate a multiresolution model of the volumetric fields. • The multiresolution format is useful for level of detail rendering and adaptive protein docking. • The volume data structure we use is a RAWV format. It is a header which contains a description of the data set, followed by the grid positioned voxel vector values. • Internal structure is a 3d grid and a colormap structure. CCV, ICES, University of Texas at Austin
Internal Data Storage, Access • DataManager has different DataSet Arrays • Each dataType is associated with API, renderer, widgets • The DataManager has a generic API with calls including load, delete, render etc. • The DataSet implements general IO functions, including capabilities, presence of expected properties etc. CCV, ICES, University of Texas at Austin
Bond level rendering • Large surface rendering can be prohibitive for interactive rendering. • We use an imposter based model to render the ball and stick model. Only one rectangle per primitive ( like sphere or cylinder ) is required. Depth and normal mapping yields true high quality surfaces. • Further speed up is achieved through our hierarchical model representation. Interactive rendering of the 1.2 million atom microtubule using the imposter model on PCs with NVIDIA programmable graphics cards CCV, ICES, University of Texas at Austin
Mesh generation • Adaptive Volume Meshes are required for obtaining adaptive potential fields. • Here, a simple listing of primitives is used as the file format rather than vrml or stl etc. Internally, surface meshes are stored and handled as isosurfaces 94847 vertices and 497327 tetrahedrons The active site groove is inside the red box. Adaptive meshes are generated in order to keep the accuracy of the groove, and reduce the number of elements at the same time. AcetylCholinesterase(2573) CCV, ICES, University of Texas at Austin
Flexibility modeling • Bond angles representation for hierarchical modeling of flexibility. • Volumetric video compression scheme for interactive rendering of 3d time varying data Time varying volumetric video Showing the hemoglobin action. Data by Dr.David Goodsell CCV, ICES, University of Texas at Austin
Compression based Computational Visualization • We use compression for the following: • Storing , streaming large datasets, including isocontours and volumes and time varying volumes. • Represent functions of proteins in a hierarchical manner to: • Render interactively and use Level of Detail algorithms • Perform protein docking CCV, ICES, University of Texas at Austin
Linear Hierarchal Basis TC:571 Haar Wavelets TC:571 CCV, ICES, University of Texas at Austin
CCV, ICES, University of Texas at Austin
Interrogative Visualization Mean curvature of 1a06 • Query with a PDB file for additional information • Potential fields • Curvature calculations • Topological information • Fast isosurface mesh extraction • Quantitative information • We have developed the contour spectrum, which we can use to obtain quantitative information like volume, surface and gradient information. • This supplements visualization for our understanding of the data sets • Time varying volumes • Track time varying quantitative changes, like volumes of components. This helps to understand the change in properties of the biomolecule as it changes over time. CCV, ICES, University of Texas at Austin
APIs • Many libraries like isocontouring , volume rendering are easy to interface to. ( inputs, outputs easy to define, understand ) • Imposter based rendering uses slightly different information format, but very similar to the hierarchical GroupOfAtoms data structure. • Volume , topological, quantitative queries can be made again as calls to libraries. CCV, ICES, University of Texas at Austin
Resources • CCV software can be downloaded from http://ccvweb.csres.utexas.edu • We are recently working on grid enabled scientific visualization. • Collaborators include Steve Cutchin (SDSC), Erik Engquist (SDSC), Art Olson (TSRI), Michel Sanner (TSRI) CCV, ICES, University of Texas at Austin
Acknowledgements • Computational resources • CCV/ICES/UT • NPACI/SDSC • Sponsors • NSF • UT/MDACC/Whitaker • NPACI/NSF • DOE-LLNL/Sandia • CCV • Dr C Bajaj • Julio Castrillon • Peter Djeu • SK Vinay • Zeyun Yu • Bong-Soo Sohn • Young-In Shin • Sangmin Park • Yongjie (Jessica) Zhang • Greg Johnson • Zaiqing Xu • KL Chandrasekhar • Qiu Wu • Jasun Sun • Anthony Thane • Shashank Khandelwal CCV, ICES, University of Texas at Austin