Coupled Data Assimilation
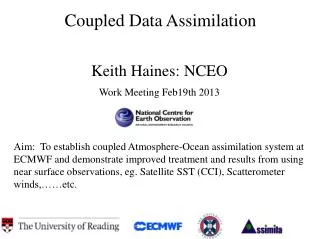
Coupled Data Assimilation. Keith Haines: NCEO Work Meeting Feb19th 2013 Aim: To establish coupled Atmosphere-Ocean assimilation system at ECMWF and demonstrate improved treatment and results from using near surface observations, eg . Satellite SST (CCI), Scatterometer winds,……etc. Agenda.

Coupled Data Assimilation
E N D
Presentation Transcript
Coupled Data Assimilation Keith Haines: NCEO Work Meeting Feb19th 2013 Aim: To establish coupled Atmosphere-Ocean assimilation system at ECMWF and demonstrate improved treatment and results from using near surface observations, eg. Satellite SST (CCI), Scatterometer winds,……etc. ESA CDA March 2012
Agenda 1730 Meeting Closes
Objectives • Three groups with 3 objectives • ECMWF: Build CERA coupled DA for future use • Reading/Edinburgh: Study near surface observations (SSTs, Wind, waves) and covariances for use in Coupled DA, and identify case studies • Reading DA: Build 1D Coupled system for testing advanced DA methods • Aim to have projects interact!!
Questions 1 • What can be tested in CERA-S system and when? • Is there 1D equivalent to CERA-S and what could be tested with it? • What can be tested in CERA-O/A and when? • Is there 1D equivalent of CERA-O/A and what could be tested?
Questions 2 • What surface observational products will be useful for assimilation within CERA • Within timescale of ESA project • Further down the line • Starting point SST and its errors and covariances • Ensure SST CCI data is suitable for use in CERA • Multivariate covariances (including other CCI data?) • Can we use covariances to improve use of current ERAInterim products? • Use improved SST from CCI with ERAInterim for ocean reanalysis/ coupled hindcasts
Task 1: Outputs • KO + 9 months D1: Workshop report, identifying priorities for coupled data assimilation research. • KO + 15 months D2 (draft): Draft report on results from experiments with simplified system, including the effect of initialisation shocks in uncoupled data assimilation. • KO + 24 months D2 (final): Final report on results from experiments with simplified system, including an assessment of the benefit of the different assimilation strategies tested.
Task 2 Outputs • KO+ 6 months D3/4: System Design and Technical Specification providing a description of the design of the coupled system and specification of the software components needed. Specification of the required tests. • KO+ 9 months D5.1: Implementation of baseline coupled system CERA-S for long coupled SST-constrained integrations (WP2.2). User documentation. Ready to use in tasks 3 and 4. • KO+ 15 months D5.2: CERA-A and CERA-O systems completed User documentation. CERA-A ready to use in tasks 3 and 4. • KO+ 21 months D5.3: Implementation of the CERA system completed and tested over a short period User documentation. • KO+24 months D5 (final): Implementation report with summary of computational performance.
Task 3: Outputs • KO+ 9 months D6 (initial): A current reanalysis assessment report identifying case study periods and showing areas where coupled model improvements may be expected • KO+15 months D7: Documentation for Opensource Visualisation software and demonstrator presenting comparisons between ocean and atmosphere reanalysis products using the observation operator codes developed for assimilation, and observations, particularly near ocean surface, for scientific and outreach use • KO+24 months D6 (final): An final impact assessment report based on Task 1, WP3.3 and 3.4 studies, describing improved representations of coupled phenomena and improved fitting to observational data.
Task 4 Outputs • KO+ 9 months D8.1: Report of sensitivities to the ocean data assimilation cycle. Implementation of options in the ocean data assimilation system. • KO+12 months D8.2: Methodology to constrain the SST implemented in the CERA-S system • KO+15 months D8.3: Production of a multi-year integration with the CERA-S system. Input to WP3.3. • KO+ 18 months D8.4: Production of a set of case studies to evaluate the impact of coupling with the CERA-A system. Input to WP3.3. • KO+ 24 months D8(Final) Demonstration experiment using the complete CERA system with parallel input to WP3.4.
ECMWF Summer Seminars September 2011
Activities • OrialKryeziu recruited started June 18th • September coupled DA workshop • Weekly Skype meetings with Merchant and Old in Edinburgh started 1st October • Analysis of European seas diurnal cycles • ERA40 and French Met Office ALADIN wind fields • METEOSAT2 SEVERI SST data • Apr-Sept 2006 • Expanded to Western Hemisphere studies (full Meteosat Disk) • Period selected April 2006-September 2008 • ERAInterim 3 hours wind data accessed for this period • Criteria for SST Case studies being revised • Further/Ongoing work • Extend Case criteria to using sea state information • Wave data from ERAInterim • Scatterometer and Altimetric waves, satellite data • Define Trusted Observation approach
Task 3: Deliverables • KO+ 9 months D6 (initial): A current reanalysis assessment report identifying case study periods and showing areas where coupled model improvements may be expected • KO+15 months D7: Documentation for Opensource Visualisation software and demonstrator presenting comparisons between ocean and atmosphere reanalysis products using the observation operator codes developed for assimilation, and observations, particularly near ocean surface, for scientific and outreach use • KO+24 months D6 (final): An final impact assessment report based on Task 1, WP3.3 and 3.4 studies, describing improved representations of coupled phenomena and improved fitting to observational data.
WP 3: Evaluating Observation StrategiesTask 3.1: Consistency of current Ocean/atmosphere analysis products OrialKryeziu Diurnal Warming: sub-daily variations in sea surface temperature (SST) defined relative to the temperature prior to diurnal stratification (foundation temperature). Aim: It is well known that surface wind stress plays an important role in diurnal stratification on time-scales of hours to days. Here we explore the correlations in spatial variations in the wind field and the spatial variability in mean or maximum dSST over the study period.
Why is sea surface diurnal warming important?Top 5 m of the ocean are responsible for absorbing 60% of the incoming solar radiation (Fairall et al., 1996). Important in ocean and atmosphere modelling: Ocean forecasting models need SSTs of the model's top layer (see Stark et al.,2007). Diurnally-varying SST rather than daily averaged SST affects air-sea fluxes and convection in modelling studies e.g. the tropical Pacific (Haman and Clayson , 2007). Improve coherency and forecasts of coupled ocean-atmosphere models e.g. Madden Julian Oscillation (Bernie et al., 2008). (fundamental contributions can be made to the understanding of the coupled ocean atmosphere system) Factors influencing diurnal warming: Net heat flux during the day associated with the daily cycle in solar heating. Wind speed. The temperature and salinity of the water. The optical attenuation coefficient of the water. Mixing from the wave motions.
- The SST data are hourly observations from SEVIRI spanning -100°W to 45°E and -60°S to 60°N mapped on a 0.05° resolution grid. Currently, data is available for one month: June 2006. Also available from SEVIRI is the “Saharan dust index” (SDI)- non-dimensional index based on infra-red wavelengths. - Peak-to-peak mean amplitude in dSST for the ocean as whole is 0.25 K. Largest dSSTs exceed 6K, and affect 0.01% of the surface (Filipiak et al., 2012).
Winds fields (ERA-interim, 3 hourly) derived from a numerical prediction model (NWF) are obtained from ECMWF. The winds in the western Mediterranean and European Seas are heavily defined by land-sea contrasts and orographic effects. Diurnal warming cases occur frequently in this region.The picture shows the mean of the reciprocal of the wind speed between 0900 and 1500 h UTC.
Mean maximum value of dSST here shows correlation with the mean reciprocal of the wind strength. It is useful to consider knowledge of frequent local wind fields to see orographic influences on diurnal variability. For example:- Surface winds accelerated through the Corsica and Sardinia passage (Merchant et al. 2008).- Mistral winds are often responsible for the clear, sunny weather in the Golfe du Lion. Mistral Wind
Extreme cases (>4K) arise under conditions with persistent light winds and strong sunlight. Sustained low winds in the morning are rare. In the North and Baltic Seas a prevalent factor in diurnal warming is the optical attenuation coefficient of water (Merchant et al. 2008).
There is an anti-correlation between the magnitude and the length scale of dSST events. Also the scales of areas of suistained low winds are smaller than those of instantaneously low winds. A few examples of dSST>4 (14pm - 9am):18th of June 2006
Conclusions: Extreme diurnal events (peak dSST > 4K) are observed by SEVIRI. In the Mediterranean sea orographic influence is an important factor. In the North and Baltic Seas, optical attenuation coefficient of water is a (significant ) driving factor. Sustained low winds are required for extreme warming events to be observed. Future work: Deriving a statistical model that relates the diurnal variations to the net surface heat flux and the wind speed. This would reproduce the observed statistics of diurnal warming and can be used in climate models. Thank You