Download
1 / 22
220 likes | 374 Views
Using Aggregated Federal Data and Local Shipping Data to Model Freight Alabama. Michael Anderson Civil Engineering The University of Alabama in Huntsville. Modeling Goals. Develop a freight OD matrix

E N D
Using Aggregated Federal Data and Local Shipping Data to Model Freight Alabama Michael Anderson Civil Engineering The University of Alabama in Huntsville
Modeling Goals • Develop a freight OD matrix • Freight profile: scalable to the State, MPO or region to identify potential freight projects National Freight Data Regional, State and MPO Level Analysis Local surveys
Integrated Freight Planning Framework Trip Generation Current Year Freight Analysis Zones Modal Split/ Assignment Trip Distribution FAZ (Mode Dependent) FAZ FAF 2 Data FAZ TRANPLAN / ATIM Interface FAZ System Performance Measures TRANPLAN Distribution & Volumes Input to ATIM FAZ Input to Gravity Distribution Model TRAN-PLAN ATIM FAZ Industry Surveys FAZ FAZ FAZ • Growth Projections • By Industry Sector FAZ Passenger Car Data FAZ Forecast by Mode Planning Factors – Value of Shipments, Personal Income, Population/Employment Industry Sector Analysis Version 1.6
Freight Analysis Framework, Ver. 2 • 114 Zones • 17 Ports of Entry • 43 Commodities • 7 Modes • Disaggregation to county level Based on Personal Income and VOS
Initial Validation at State Boundary Weighted average of tons per truck crossing Alabama’s borders is 15 tons. Differences in weight results from differences in commodities being shipped different directions.
Application of FAF2 – Statewide Model • Internal to Zone 1 • Internal to Zone 2 • From Zone 1 to Zone 2 • From Zone 2 to Zone 1 • From Zone 1 to locations outside Alabama • From Zone 2 to locations outside Alabama • From outside Alabama to Zone 1 • From outside Alabama to Zone 2 • National Pass-Through
Mobile, AL: Convergence of two Interstates:I-10 running EWI-65 running NS
Mobile’s Freight Reality • Class A Railroads in Mobile • Mouth of Alabama’s inland Waterways; 4500 miles of system via Tenn-Tom • 25 steam ship agencies • 4 foreign trade zones • 60 trucking companies • 4 bulk liquid terminals • 13 warehouses, 9 of which are US Customs bonded • 16 shipbuilding or ship repair companies
Freight Modeling • None! • State of Alabama used “estimated” percentages for truck trips • Truck trips were estimated percentage as a Non Home Based trips • Trucks are not factored in the External to External trips, or Internal / External Trips • No other mode than cars are modeled
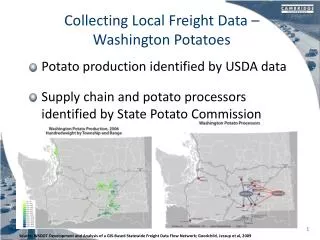
Local Data • What can industry input provide when developing a long-term freight plan? • Gain insight from companies to plan for pattern shifts, network realignments, or current industry trends. • Build relationships with business leaders so they become a vital source of planning intelligence.
Key Data Points • Business description • Number of employees • Mode of shipments • Number of deliveries received by mode weekly • Number of shipments by mode generated weekly • Origins of inbound deliveries (at least compass direction) • Destinations of outbound shipments (at least compass direction) • Size of shipment by mode (Full load, Less than full load) • Weight of shipments in pounds by mode (average/normal) • Size of facility in square feet (under roof) • Expansion plans for forecast period (5 years) • Value of Goods (dollars) • Actual annual volume of goods for prior year (should approximate Q5+Q6 x 52) • Forecasted annual volume of goods for next year • Transportation problems at their location • Transportation problems in the region
Conclusions to Local Data Collection The information gathered through this process, along with information on commodity flows from around the country, allowed the MPO to produce an intelligent estimate of freight movement within the study area and resulted in a validated transportation model.
Trip Purposes • External-External • Nation-Alabama • Nation-Mobile County • Alabama-Mobile County • Port-Nation • Port-Alabama • Port-Mobile County • Internal to Mobile
Mobile Freight Assignment • Combination of FAF2 data and Regional Freight Profile • Freight OD Matrix Entered as Preload
Overall Conclusions • New Ability to Model Truck Trips • Scalable : Regional, Statewide, Local • Use of FAF2 forecasts Local Freight Data • Analyze projects considering freight impacts
Questions? Michael Anderson 256-824-5028 mikea@cee.uah.edu Office for Freight, Logistics & Transportation