Download
1 / 32
320 likes | 523 Views
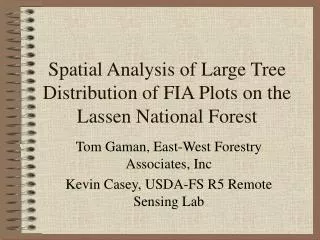
Spatial Analysis of Large Tree Distribution of FIA Plots on the Lassen National Forest. Tom Gaman, East-West Forestry Associates, Inc Kevin Casey, USDA-FS R5 Remote Sensing Lab. Our FIA Investigation. Examine the Statistical Value of Collecting Hectare Tree Data.

E N D
Spatial Analysis of Large Tree Distribution of FIA Plots on the Lassen National Forest Tom Gaman, East-West Forestry Associates, Inc Kevin Casey, USDA-FS R5 Remote Sensing Lab
Our FIA Investigation • Examine the Statistical Value of Collecting Hectare Tree Data. • Test spatial relationships among trees using the distance and bearing data to index plot structure. • Create plot “cartoons” and relate to high-resolution imagery, hence to landscape
Examine the Statistical Value of Collecting Hectare Tree Data.
2002 Lassen National Forest Densification & FIA Hex Plots • 132 plots – 83 have HA trees • 66 had multiple HA trees >= 32.0” dbh 1 ac. Vs. 1 ha.! What do we gain from the extra work?
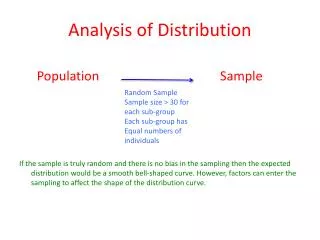
Methods • Select large trees on annular plot using the distance and azimuth data. • Create 2 data sets for each plot • All Hectare Trees • Hectare Trees on ¼ acre annular plots only • Statistical Analysis # Large Trees. Acre data (expanded to ha value) vs. hectare data by mapped forest “Type”
Statistical Analysis of Results 11.8% 14.0% • Conclusions. • Though SE consistently somewhat less for HA sampling by type, difference • would reduce with larger # plots. • Smaller (4 of the ¼ acre) samples may overestimate # large trees/ha • 3. Ha Plots offer an excellent tool for more accurately quantifying large trees on • individual plots but of limited value in reducing the error for large samples.
Statistical Analysis of Results Mean # HA trees/Hectare by type • Conclusions. • Though SE consistently somewhat less for HA sampling by type, difference • would reduce with larger # plots. • Smaller (4 of the ¼ acre) samples may overestimate # large trees/ha • 3. Ha Plots offer an excellent tool for more accurately quantifying large trees on • individual plots but of limited value in reducing the error for large samples.
Test spatial relationships among trees using the distance and bearing data to index plot structure. Creating the “Clumping Index”
Methods • Selected 11 plots…1 randomly for each forest “Type” per regional type map. • Calculate coordinate locations of each tree and create a shapefile for each plot. 0614151
Tested a variety of methods which did not work 0606172
Calculate Proximity • Use Proximity Analysis tool to create “PROXIMITY POLYGONS” • Calculate area of each polygon and total plot 0614151
Calculate “Clumping Index” • Divide total area by number of trees to obtain AVERAGE polygon which would represent equal spacing (as in a plantation) • Divide actual area of each PROXIMITY POLYGON by AVERAGE thus obtaining an expression of POLYGON CLUMPING. • Average the two lowest POLYGON CLUMPING values to obtain the CLUMPING INDEX.
Clumping Index Values Low Value—Most Clumping High Value—even distribution 0614335 0615554
Conclusions from Clump Index: • “Indexing” may be a valuable use of FIA for ecological modeling of variability within the landscape • Would be interesting to examine relationships among snags and smaller trees • The index could be derived directly from tree data without all the interim steps.
Create plot “cartoons” and relate to high-resolution imagery, hence to landscape.
Mapped the Inventory Plots using Distance and Azimuth Data from Tree (*.TRE) files
Conclusions from SVS process: • Trees can be realistically drawn in their true locations using SVS. • GPS coordinates can be used to locate plot centers on geo-referenced imagery. • Annular and hectare plots can be accurately drawn over imagery. • In dense stands individual trees are very difficult to identify.
Conclusions • Spatial Analysis allows us to extract more information on individual plots • FIA data may be valuable in modeling relationships • www.forestdata.com