Download
1 / 18
180 likes | 256 Views
This report delves into the current chloride levels in waters of Dutchess County, highlighting potential impacts on the environment and human health. It outlines rising trends, discusses associated risks, and proposes solutions for managing salt pollution. Key stakeholders and their contributions are acknowledged. 8 Relevant

E N D
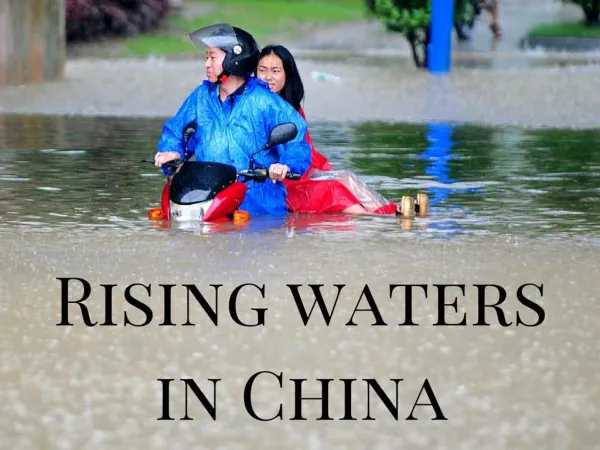
Salt in Dutchess Co. Waters Where are we now? Compared to what? Where are we headed? Should we be worried? Stuart Findlay Vicky Kelly
Acknowledgements • Fishkill Creek Watershed Comm. (R. Oestrike) • Environmental Management Council (D. Burns, C. Klocker) • Hudson River NERR (W.C. Nieder, S. Ciparis) • Town of Clinton CAC (N. Coller) • Vassar College (K. Menking et al.) • Syracuse U. (D. Siegel, L. Jin) • WRI – Cornell; COE - Syracuse
Some Chloride Reference Points • Background - ~ 10 mg/L or less [Catskill Reservoirs] • Sublethal – 50-100 mg/L Subtle yet Significant • Biotic Indices • Microbial processes • Associations • EPA Chronic – 230 mg/L • Drinking Water Std – 250 mg/L • EPA Acute – 860 mg/L • Lethal - 1000 or higher
SIMPLER • REFERENCE <10 mg/L • ENVIRONMENTAL EFFECTS ~ 100 mg/L • LETHAL > 1000 mg/L DUTCHESS COUNTY WATERS 80 mg/L (+/- 79 SD)
DC Mullaney et al., USGS
Chloride (mg/L) Crum Elbow 15-50 Ten Mile 10-40 Casperkill 100-300 Wappinger 10-45 Fishkill 10-100
Downstream Increases FISHKILL CREEK Summer 2005 Population
Residential Land Cover and Chloride (M. Essery) Subwatersheds in the Fishklill Basin
No decline in summer concentrations High concentrations in summer • East Branch Wappinger Creek, Millbrook
Long-term increases in concentration East Branch of the Wappinger Creek Kelly et al. ES&T 2008
Saw Kill CreekHRNERR • Low-density residential • Yearly mean Cl-concentrations have doubled since 1991 (20 to 40 mg/L) • Similar Cl- concentrations throughout year
All Patterns Suggest a Reservoir • Road salt biggest source – others? • Soil Sorption or Groundwater? STREAM
SOIL CORES HOLD Cl LONGER THAN WATER Kincaid and Findlay, 2009
Fig. 4: Frequency distribution of chloride concentrations in surface and well samples from Dutchess County. Groundwater ? Private drinking-water wells Non-random but widely distributed A few wells have Cl > surface water concentration – Could support high baseflow concentrations
CHLORIDE IS NOT ALONE D. Burns - EMC
Should we be Worried? • At the brink, trends are not encouraging • Groundwater concentrations must be increasing • What else is coming along?
Scope for Action • Reduced Salt is in Everyone’s Interest • Widespread Problem, Lots of Mental Horsepower • Solutions may Require Capital
What do we Need to Know?Today’s Program • Environmental Effects – Not Huge Yet but Close? • Human Health Effects • Cost • Direct (Salt is cheap, labor is not, use is high) • Indirect (Corrosion, contamination • Solution?