Aggregate Supply in Economics
120 likes | 180 Views
Learn about Aggregate Supply in the national economy model, distinguish between short run and long run, and grasp how price levels impact production over time. Discover the relationship between Long-Run Aggregate Supply (LRAS) and Short-Run Aggregate Supply (SRAS) in the economy. Understand how changing price levels affect output and the role of technology and resources in shaping production capacity.

Aggregate Supply in Economics
E N D
Presentation Transcript
Aggregate Supply The AS is the part of our national economy model where the production side is studied.
Time Frame As we build a model of the national economy we will need to distinguish between the short run and the long run. (Some of you may have seen the short run and the long run in a micro class. But in this macro class the reason for having both time frames is different than in micro – please note that an try to keep the two straight.) I like to have you think about an analogy to get a feel for the long run and the short run. Imagine that you are running – for now it does not matter what shape you are in, just think about running. When you run right now you have a pace at which you run. The pace is determined by your general health. In a “long run” you will go at your pace.
Time Frame For short periods of time you may run faster than the pace – to bet the traffic light or something, or you may run slower than the pace – you know you can not beat the traffic light so you slow down, but still run to keep moving (you are afraid if you quit running you will walk home and never exercise again.) In the long run in the economy there is a natural “pace” for output. That pace is determined by the state of technology and the amount or endowment of resources we have. Long term, the economy will gravitate toward that natural pace. (If you have every jogged you know the pace changes the better shape you are in – and the same is true in the economy.)
Graph Price level, P Remember we want to use a diagram or graph like this. Let’s see how the long run aggregate supply (LRAS) fits in the graph. RDGP
Long run Given a state of technology and resource endowments the LRAS is shown as one level of RGDP. We place it in the graph at a level – actually determined by looking at real world data. Since it is a vertical line, we see that if the price level should change the quantity supplied in the long run will not change. P LRAS P2 P1 RGDP RGDP1
Long Run The reason the LRAS is a vertical line is because a price level change can not change the level of output – only better technologies or more resources can change the LRAS. In fact, if better technologies or more resources are found the LRAS will shift to the right. Now let’s think about the short run.
Short Run P LRAS The SRAS has an upward slope to it as we view it from left to right. SRAS P2 P1 RGDP1 RGDP2 RGDP
Short Run On the previous screen you see that at P1 the SRAS = LRAS supply. Let’s start here to make our life easier. Now say the price level in the economy starts to rise. How can more be produced in the economy above the natural “pace?” First of all, with a higher price level firms see greater profits – revenue minus cost – and want to expand output. So, just like you can sprint for a bit while running, in the economy more will be produced by adjusting hours of work for labor and more intensely use machines to get the additional output. Similarly, if the price level falls from P1, less profits mean less production by working labor less and not using the machines as much.
Shifts in SRAS • Just as in the long run, if we get new and better technologies or more resources the SRAS will shift to the right. • If input prices rise the cost of production rises and thus, at a given level of output prices, profitability falls. The SRAS would shift to the left. If input prices fall the SRAS shifts right for a similar reason.
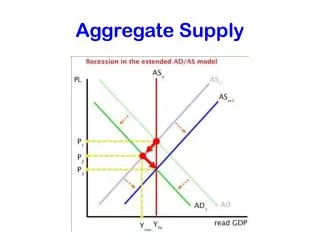
Connecting the LRAS and SRAS P LRAS SRAS2 SRAS1 P2 P1 RGDP1 RGDP2 RGDP
Connecting the LRAS and SRAS 1 – start at the P1 LRAS and SRAS1 point. 2 – if the price level should rise to P2 we will move up the SRAS1 like we said a few slides ago. But just like you can not sprint for a long time, output can not be above the normal pace for long. Here is how adjustment occurs in the long run. As the output price level rose, hours of work were adjusted. In the long term input prices will rise to compensate resources for the “running at full steam.” Perhaps ironically, the input prices rising will match the output price rise, moving profit back and thus the SRAS to SRAS2 at P2 to match LRAS again.
summary In the short run if the output price level changes, output can change from the long run level set by technology and resource endowments, but eventually input prices adjust and bring output back in line with the long run pace. We will see later that the time it takes to adjust my be unsatisfactory to you and me. We may want monetary or fiscal policy tools – we discuss later – to “correct” the situation faster.