
Sampling Error
E N D
Presentation Transcript
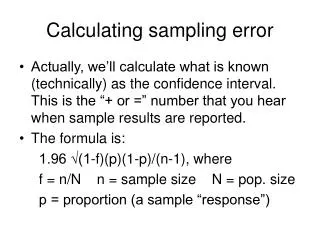
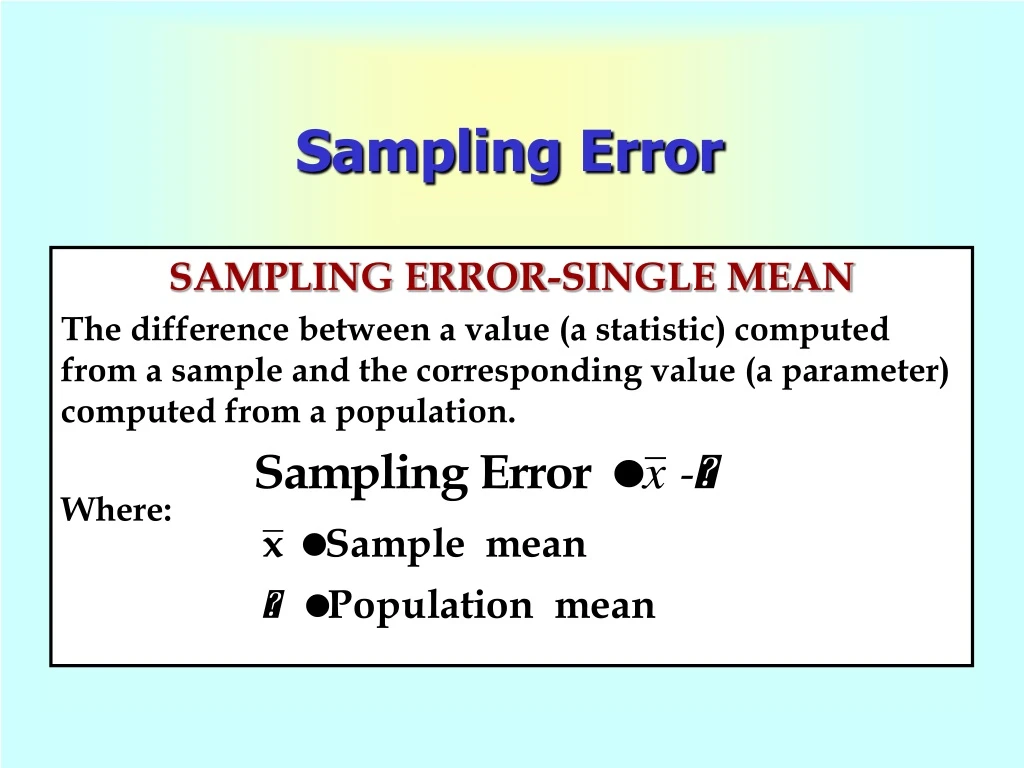
Sampling Error SAMPLING ERROR-SINGLE MEAN The difference between a value (a statistic) computed from a sample and the corresponding value (a parameter) computed from a population. Where:
Sampling Distributions A sampling distribution is a distribution of the possible values of a statistic for a given size sample selected from a population.
Sampling Distribution of the Mean THEOREM 6-1 If a population is normally distributed with a mean and a standard deviation , the sampling distribution of the sample mean based on n observations is also normally distributed with the same mean and a standard deviation of .
Sampling Distribution of the Mean THEOREM 6-2: THE CENTRAL LIMIT THEREOM For samples of n observations taken from a population with mean and standard deviation , regardless of the population’s distribution, provided the sample size is sufficiently large, the distribution of the sample mean , will be approximately normal.
Sampling Distribution of the Mean THE CENTRAL LIMIT THEREOM (Continued) The mean of the distribution of is equal to the population mean . The standard deviation will equal the population standard deviation divided by the square-root of the sample size . The larger the sample size, the better the approximation to the normal distribution.
Sampling Distribution of the Mean Z-VALUE FOR SAMPLING DISTRIBUTION OF where: = Sample mean = Population mean = Population standard deviation n = Sample size
Example of Calculation z-Value for the Sample Mean(Example 6-5) What is the probability that a sample of 100 automobile insurance claim files will yield an average claim of $4,527.77 or less if the average claim for the population is $4,560 with standard deviation of $600?