Download
1 / 1
20 likes | 216 Views
Argos ID (WMO ID). Date of Deployment. Location of Deployment. Period of Data (month). Drifting depth (m). Cycle (day). Launched by. 24890(2900170). Oct. 22, 2001. 37.58. 130.52. 12. 800. 7. METRI. 24892(2900171). Oct. 22, 2001. 37.58. 129.90. 800. 7. ". 24680(5900193).

E N D
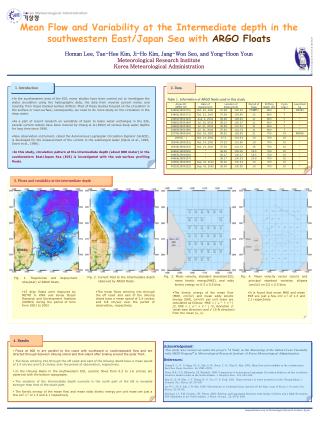
Argos ID (WMO ID) Date of Deployment Location of Deployment Period of Data (month) Drifting depth (m) Cycle (day) Launched by 24890(2900170) Oct. 22, 2001 37.58 130.52 12 800 7 METRI 24892(2900171) Oct. 22, 2001 37.58 129.90 800 7 " 24680(5900193) Aug. 2, 2002 38.28 129.40 11 800 7 " 24681(5900194) Jul. 30, 2002 38.10 130.37 11 800 7 " 24682(5900195) Jul. 31, 2002 35.59 131.51 11 800 7 " 24683(5900196) Jul. 31, 2002 37.30 131.73 11 800 7 " 23734(2900204) Oct. 19, 2001 38.52 129.50 21 700 10 KORDI 18543( - ) Oct. 13, 2001 37.3 131.43 10 700 10 " 18544(2900202) Oct. 14, 2001 37.23 131.90 19 700 10 " 18545(2900203) Oct. 14, 2001 37.30 131.72 16 700 10 " 04664(2900205) " 36.00 130.00 20.5 700 10 " 04665(2900206) " 36.17 130.17 16.5 700 10 " 04666(2900207) " 36.17 130.33 20.5 700 10 " 04684(2900209) Sep. 02, 2002 36.00 130.33 10 700 10 " 04252(2900225) Sep. 02, 2002 36.00 130.50 10 700 10 " Mean Flow and Variability at the Intermediate depth in the southwestern East/Japan Sea with ARGO Floats Homan Lee, Tae-Hee Kim, Ji-Ho Kim, Jang-Won Seo, and Yong-Hoon Youn Meteorological Research Institute Korea Meteorological Administration Meteorological Research Institute 2. Data 1. Introduction • In the southwestern area of the EJS, many studies have been carried out to investigate the water circulation using the hydrographic data, the data from moored current meter, and recently, from Argos tracked surface drifters. Most of these studies focused on the circulation in the surface or near-surface; consequently, we need to do more study on the circulation in the deep water. • As a part of recent research on variability of basin to basin water exchanges in the EJS, several current meters have been moored by Chang et al.(2002) at various deep water depths for long time since 1996. • New observation instrument, called the Autonomous Lagrangian Circulation Explorer (ALACE), is developed for the measurement of the current in the submerged water (Davis et al., 1992; Davis et al., 1996). • In this study, circulation pattern at the intermediate depth (about 800 meter) in the southwestern East/Japan Sea (EJS) is investigated with the sub-surface profiling floats. Table 1. Information of ARGO floats used in this study 22 3. Flows and variability at the intermediate depth Fig. 3. Mean velocity, standard deviation(SD), mean kinetic energy(MKE), and eddy kinetic energy on 0.5 x 0.5 bins. Fig. 4. Mean velocity vector (cm/s) and principal standard variation ellipses (cm/s)2 on 0.5 x 0.5 bins. Fig. 2. Current field at the Intermediate depth observed by ARGO floats. Fig. 1. Trajectories and deployment sites(star) of ARGO floats. • 15 Argo floats were deployed by METRI in KMA and Korea Ocean Research and Development Institute (KORDI) during the period of time from 2001 to 2002 • The mean flows entering into through the off coast and east of the Ulleung island have a mean speed of 2.4 cm/sec and 0.8 cm/sec over the period of observation, respectively. • The kinetic energy of the mean flow (MKE, cm2/s2) and mean eddy kinetic energy (EKE, cm2/s2) per unit mass are calculated as follows: MKE = ( u 2 + v 2 ) /2, EKE = ( u’ 2 + v’ 2 ) /2, deviation u’ (west-east direction) and v’ (S-N direction) from the mean (u, v). • It is found that mean MKE and mean EKE are just a few cm2 s-2 of 1.3 and 2.1 respectively. 4. Results Acknowledgement: This study was carried out under the project, “A Study on the Monitoring of the Global Ocean Variability with ARGO Program” in Meteorological Research Institute of Korea Meteorological Administration. • Flows at 800 m are parallel to the coast with southward or southeastward flow and are directed through between Ulleung island and Dok island after sinking around the polar front. • The flows entering into through the off coast and east of the Ulleung island have a mean speed of 2.4 cm/sec and 0.8 cm/sec over the period of observation, respectively. • In the Ulleung Basin in the southwestern EJS, cyclonic flows from 0.3 to 1.6 cm/sec are observed with the bottom topography. • The variation of the intermediate depth currents in the north part of the UB is revealed stronger than that of the south part. • The kinetic energy of the mean flow and mean eddy kinetic energy per unit mass are just a few cm2 s-2 of 1.3 and 2.1 respectively References: Chang K.-I., N. G. Hogg, M.-S., Suk, S.-K., Byun, Y.-G., Kim, K. Kim, 2002. Mean flow and variability in the southwestern East Sea. Deep-Sea Res., 49, 2261-2279. Davis, R.E., P.D. Killworth, J.R. Blundell, 1996: Comparison of Autonomous LagrangianCirculation Explorer ad fine resolution Antarctic model results in the South Atlantic. J. Geophys. Res., 101, 855-884. Kim, K., K.-R. Kim, J.-Y. Chung, H.-S. Yoo, S.-G. Park, 1991. Characteristics of water properties in the Ulleung Basin. J. Oceanol. Soc. Korea, 26, 83-100. Lie H-J., M.-S. Suk, C.H. Kim, 1989. Observations of southward deep currents off the East coast of Korea. J. Oceanol. Soc. Korea, 24, 63-68. McClean, J.L. P.M. Poulain, J.W. Pelton, 2002: Eulerian and Lagrangian Statistics from Surface Drifters and a High-Resolution POP Simulation in the North Atlantic. J. Physi. Oceano., 32, 2472-2491. homann@metri.re.kr in Meteorological Research Institute, Korea